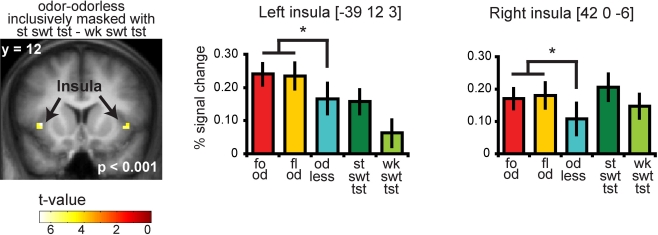
Figure 5.
Coronal section showing neural response to food and floral odors vs. odorless air in bilateral insula, inclusively masked by response to strong sweet taste minus weak sweet taste. The bar graphs show the percent signal change for the three odor conditions: food (red), floral (yellow), and odorless air (blue), and the two taste conditions: strong sweet taste (dark green) and the weak sweet taste (light green) (±s.e.m.), averaged over subjects. The response was taken from the voxel that responded maximally, as identified in the SPM analysis. Thus, these estimates are non-independent, and are provided to illustrate the relative difference in neural response.

