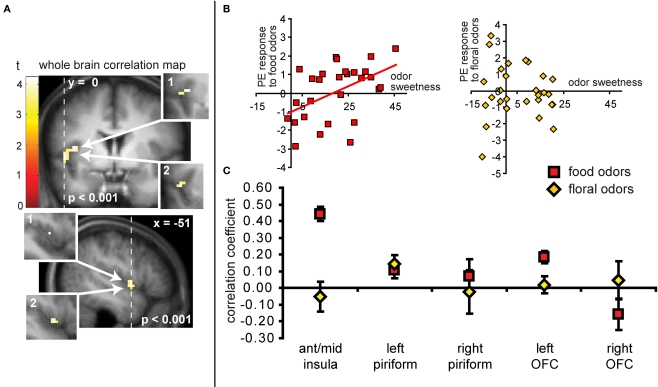
Figure 6.
(A) Coronal and sagittal sections of the area of insula where neural response to the food odors shows a positive correlation with the sweetness ratings of those odors. The main images display the unmasked regression maps while the insets labeled 1 depict the masked regressions (i.e., using the “sweet odors and sweet taste overlap” inclusive mask). The insets labeled 2 depict the analysis with the pleasantness and familiarity ratings as covariates. (B) Shows neural response (in parameter estimate) in the insula (at the maximally responding voxel at −45 −3 9), plotted against sweetness ratings for the food (red squares) and floral odors (yellow diamonds). (C) Illustrates the magnitude of the correlation (averaged across all voxels ± standard deviation) in the insula for food odors (in red squares) and non-food odor (yellow diamonds) in comparison to the responses in other areas for food and non-food odors vs. odorless. Note that although there appears to be a significant difference between food and floral odors in the left OFC, this effect this effect does not survive our criterion for significance in SPM and is therefore not discussed.

