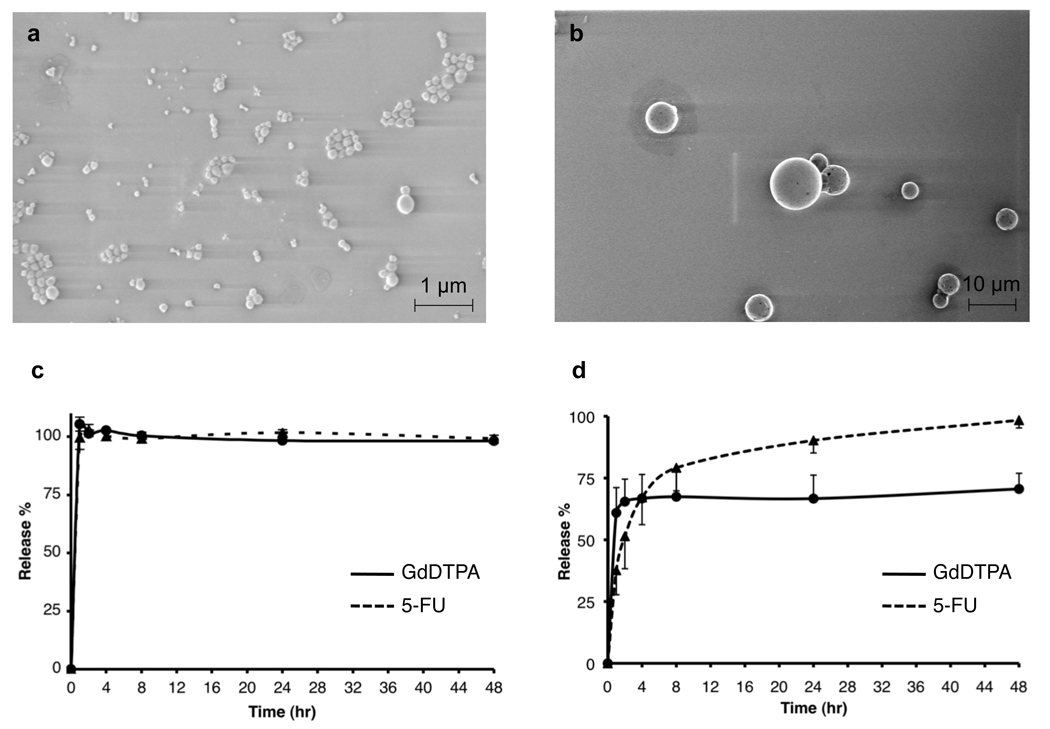
Fig. 2.
In vitro characteristics of PLGA nano/microspheres. Scanning electron microscope (SEM) images of (a) PLGA nanospheres (NS-GdDTPA/SPIO/5-FU) and (b) PLGA microspheres (MS-GdDTPA/SPIO/5-FU). In vitro release profiles of GdDTPA and 5-FU from (c) NS-GdDTPA/SPIO/5-FU and (d) MS-GdDTPA/SPIO/5-FU. The quantification of GdDTPA was performed by T1 measurement of release medium with a calibration curve using standard Omniscan®, based on the linear relationship between GdDTPA concentration and 1/T1 (R2=0.999 for 0.5 µM – 50 mM on 9.4T MRI). The quantification of 5-FU was performed using reverse-phase HPLC. Please see supplemental materials for details.

