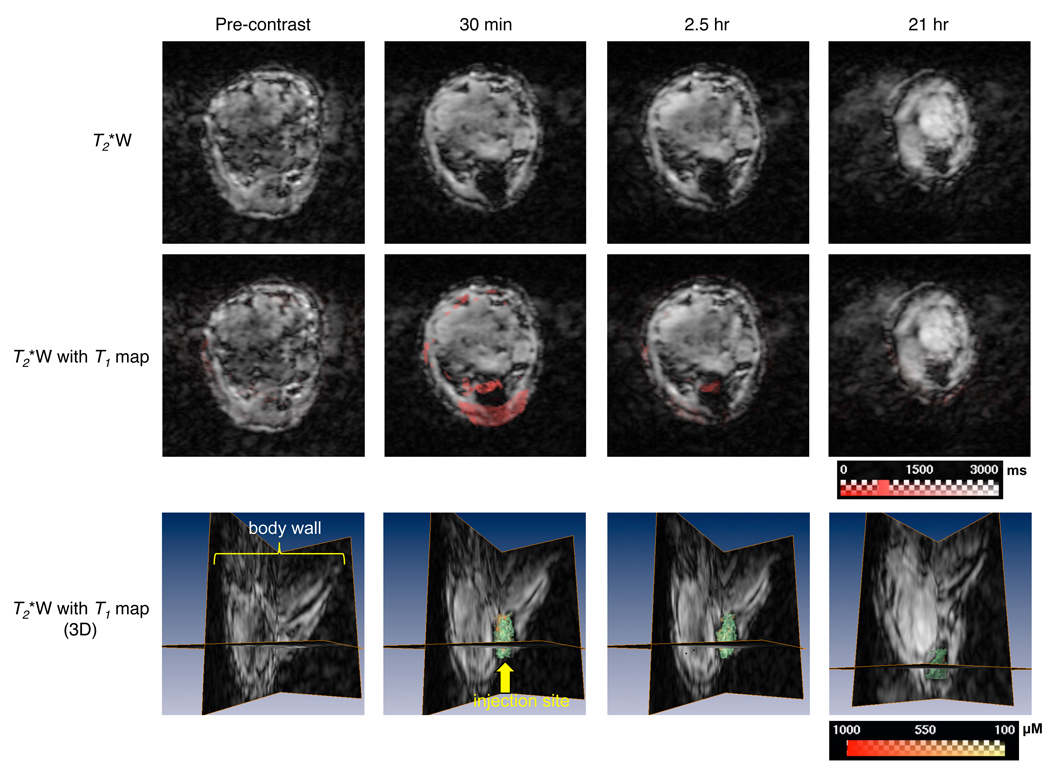
Fig. 4.
In vivo monitoring of the release of GdDTPA from MS-GdDTPA/SPIO/5-FU by dual MR contrast technique in MCF-7 breast cancer xenografts. Two-dimensional MR images were from one representative slice out of 128 slices in the z-direction. From the top row panels, we could identify the location of MS-GdDTPA/SPIO/5-FU as a dark spot on T2*-weighted MRI. We could observe, on the T1 map, a decrease in the T1 values of the tumor around the area where the PLGA microspheres were injected, notably at 30 min, and slightly, at 2.5 hr after intratumoral administration (panels of the middle row). In the bottom panels (T2*-weighted images overlaid with quantitative T1 values), the green channel represents SPIO-loaded PLGA microspheres, and the red-yellow channel indicates the distribution of GdDTPA released from the MS-GdDTPA/SPIO/5-FU in the tumor. Similar to the intravenous injection of NS-GdDTPA/SPIO/5-FU, we were able to determine the spatial distribution of GdDTPA released from the MS-GdDTPA/SPIO/5-FU quantitatively. Scale bars represent the range of T1s in milliseconds in the panels of the middle row, and the range of the concentration of GdDTPA in micromolars in the bottom row.

