Figure 2.
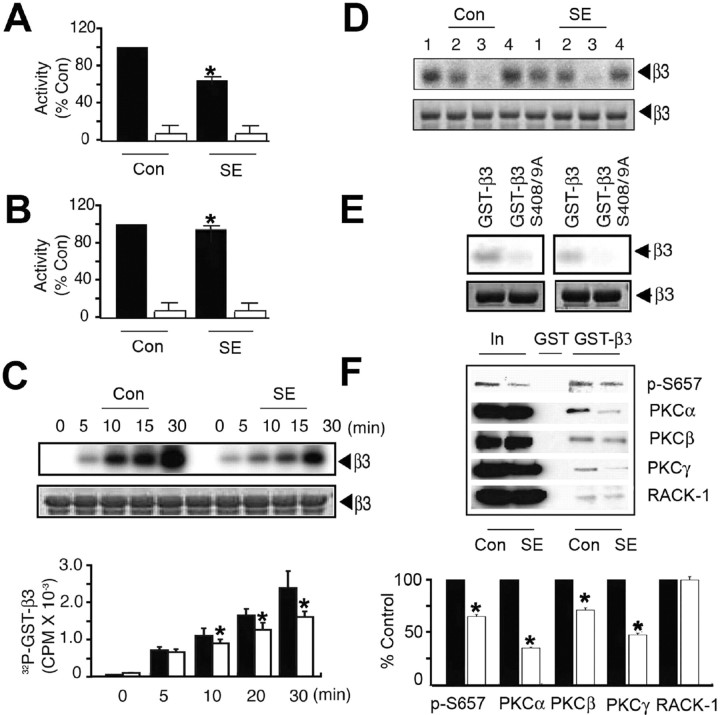
SE decreases PKC activity and interaction with the GABAAR β3 subunit. A, B, SE decreases PKC activity in the hippocampus. A, Detergent-solubilized hippocampal extracts from control and SE were exposed to 50 μm neurogranin peptide in the absence (filled bars) and presence (open bars) of 100 nm PKCI19–36 inhibitor peptide in the presence of 10 μCi 32P-γATP. Data were normalized to level of activity seen with control extracts (100%). B, Similar experiments were also performed using 50 μm Kemptide, a PKA substrate, in the absence (filled bars) and presence (open bars) of 20 nm Walsh peptide, a specific PKA inhibitor, and data were normalized to the level of activity evident in control (100%). C, Phosphorylation of GST-β3 by hippocampal extracts. Top, Fusion proteins were incubated with hippocampal extracts, and bound material was incubated with 10 μCi of 32P-γATP at 30°C followed by SDS-PAGE. Bottom, The level of phosphorylation was then calculated, and data were normalized to levels seen with control extracts (100%). D, PKC activity mediates the phosphorylation of GST-β3 by hippocampal extracts. Material bound to GST-β3 was incubated for 30 min with 10 μCi 32P γATP at 30°C under control conditions (1) or in the presence of 1 μm KT5720 (2; PKA inhibitor), 15 μm GF 109203 (3; PKC inhibitor), or 10 μm KN-62 (4; Ca/calmodulin type 2-dependent protein kinase), and phosphorylation was examined by SDS-PAGE. E, Hippocampal extracts phosphorylated GST-β3 on S408/9. GST-β3 or a mutant in which S408/9 had been converted to alanine residues were incubated with hippocampal extracts, bound material was incubated for 30 min with 10 μCi 32P-γATP at 30°C, and phosphorylation was measured via SDS-PAGE. Top, Autoradiogram. Bottom, Coomassie stain of the same gel. Left, Control; right, SE. F, PKC binding to GST-β3 is reduced from SE extracts. Top, Material bound to GST-β3 was immunoblotted with antibodies against p-S657, antibodies specific to individual PKC isoforms, and against RACK-1. Bottom, The level of binding for each protein was then determined for control (filled bars) and SE (open bars) extracts, with data being normalized to the levels seen from control (100%). In all panels, asterisks indicate significant difference from control (p < 0.01; Student's t test; n = 7–10).

