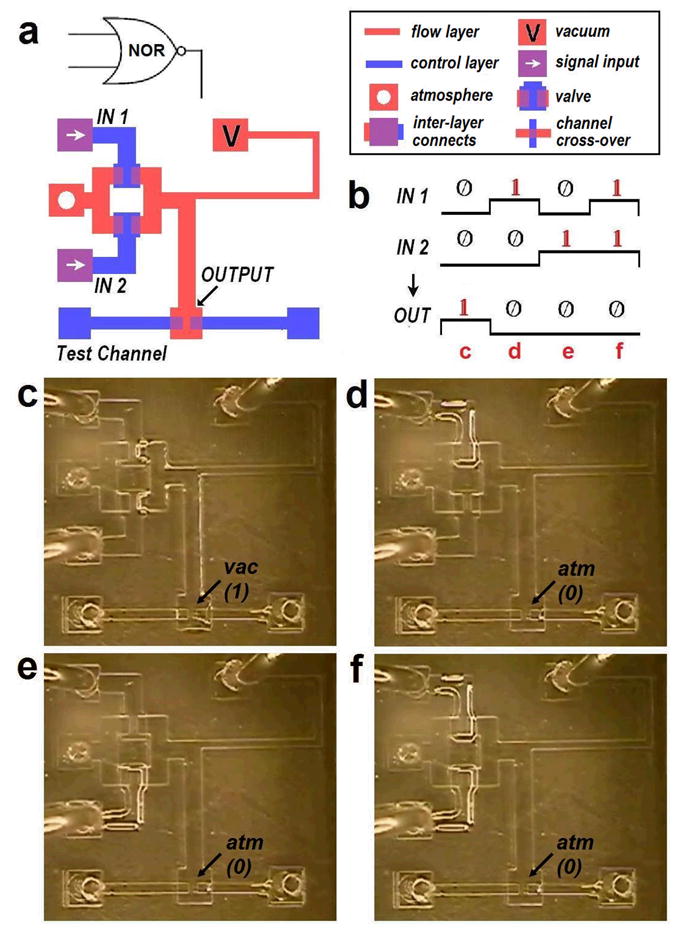
Figure 4.

NOR gate schematic and operation. (a) CAD design of a NOR gate. In this and later figures, the bottom ‘control’ layer is shown in blue while the upper ‘flow’ layer is in red. The overlapped regions are visible in violet. Red squares with an empty circle are the holes that remain open to atmosphere during operation and those with ‘V’s indicate connections to vacuum reservoir. White arrows in the squares show the signal input locations and violet squares represent inter-layer connections between the bottom and upper layers. Channel crossovers between two layers are also shown in violet, but not as an individual square. (b) Output variations depending on two inputs. (c) NOR gate working with the 0-0 input. The output channel shows deformation or increased light reflection around the boundaries due to the existing vacuum (i.e., an output state of 1). (d) NOR gate with the 1-0 input. The upper input valve is open while the other remains closed. The output channel is now connected to atmosphere and light reflection decreases as the channel redeems the original shape. The output is obtained for (e) a NOR gate with a 0-1 input and (f) a NOR gate with a 1-1 input.
