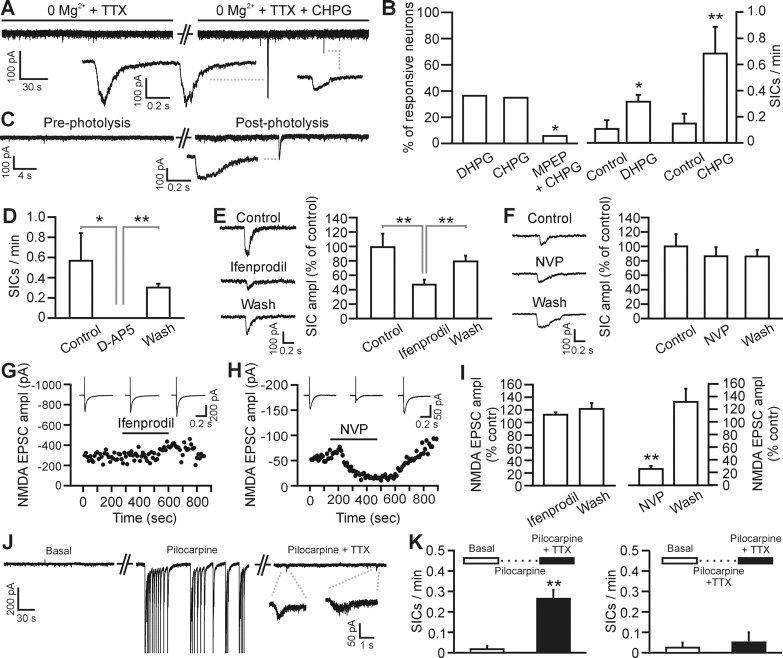
Figure 4.
Gliotransmission but not intracortical synaptic transmission activates the NR2B-containing NMDA receptors of layer 2–3 pyramidal neurons. A, Whole-cell recording from a pyramidal neuron showing SICs induced by bath application of CHPG (0.5 mm). In these as well as in B–F, experiments are performed in the continuous presence of TTX (1 μm). B, Left, Percentage of neurons showing increased SIC frequency after application of DHPG (10–20 μm; 4 of 11 cells), CHPG (0.5–1 mm; 7 of 20), and CHPG and MPEP (0.5–1 mm and 50 μm, respectively; 1 of 17). In the latter experiments, the slice was preincubated with MPEP for 5 min before the application of CHPG and MPEP. The ability of MPEP to block actions of CHPG was tested using Fisher's exact test (p < 0.05). Right, Average frequency of SICs before and after DHPG (n = 4) and CHPG (n = 7) in the responsive neurons shown in the left panel. In this as well as in the other panels of this figure, *p < 0.05 and **p < 0.01. Error bars indicate SEM. C, Whole-cell recording from a pyramidal neuron showing SICs induced by photolysis of caged Ca2+ in single cortical astrocytes. D, Average frequency of SICs under control conditions, in the presence of d-AP5 (50 μm), and after d-AP5 washout in six cortical neurons showing SIC activity. SICs were stimulated by application of CHPG (0.5–1 mm) or low Ca2+ containing ACSF. E, F, Mean amplitude of SICs under control conditions, in the presence of ifenprodil (E; 3 μm) or NVP-AAM077 (F; 0.4 μm), and after drug washout. Data are normalized to the amplitude of SICs recorded under control conditions. See inset for representative SICs from the same cell under the different experimental conditions. Number of averaged SICs is 37, 48, and 70 from 9 cells for E, and 27, 25, and 13 from 7 cells for F, respectively. G, H, Representative experiments showing the time course of the NMDA EPSC-amplitude at basal condition (0 Mg2+-containing saline in the presence of 10 μm NBQX), during ifenprodil (G; 3 μm) and NVP-AAM077 (H; 0.4 μm) application, and after drug washout. Subsequent application of d-AP5 (50 μm) completely blocked the EPSC (data not shown). Inset, Average of 10 EPSCs in the different experimental conditions. EPSCs were evoked by positioning the stimulating electrode intracortically, 100–200 μm from the recording pipette. I, Ifenprodil (left; 3 μm) does not decrease the average amplitude of the NMDA EPSC (n = 6 cells), whereas NVP-AAM077 (right; 0.4 μm) drastically reduces its amplitude (n = 4 cells). Data are normalized to the average NMDA EPSC amplitude under control conditions. J, Epileptiform activity induced by acute application of pilocarpine (10 μm) triggers an increase in SIC frequency. Representative experiment showing membrane current under basal conditions (left), in the presence of pilocarpine (middle), and in the presence of pilocarpine and TTX (1 μm; right). Addition of TTX blocks pilocarpine-induced epileptiform activity and reveals the presence of SICs. Pilocarpine was always applied in the presence of 0 Mg2+ and 100 μm picrotoxin (see Materials and Methods). During epileptiform activity, unclamped action potentials were recorded and have been truncated for presentation purposes. K, Average SIC frequency under basal conditions in normal ACSF before perfusion of pilocarpine (left; open bar). After epileptiform activity was triggered by application of pilocarpine, 1 μm TTX was added to the saline to block neuronal activity. Thereafter, SIC frequency was measured again in 6 of 10 layer 2/3 neurons displaying SICs (left; filled bar). When TTX was added together with pilocarpine, no epileptiform activity was initiated in the slice and no significant increase in SIC frequency was observed in four of seven neurons displaying SICs (right).

