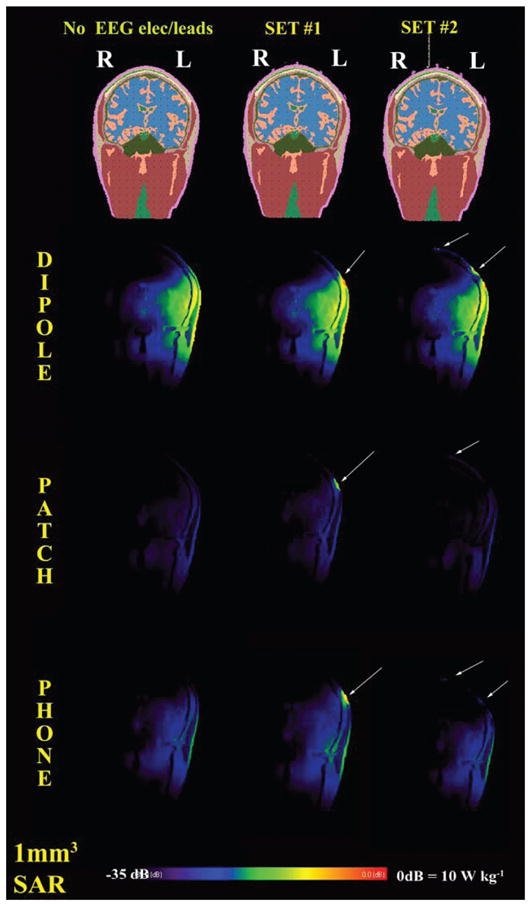
FIG. 3.

Coronal view of SAR for the control case (no leads) and the two sets of EEG electrodes/leads. The sources were a half-wave dipole antenna, a patch antenna and a mobile phone at 915 MHz. All sources were on the left of the head (i.e., right in the image as for radiological convention). Values normalized for 0.25 W of available input power. Arrows indicate local increases in SAR underneath the EEG electrodes.
