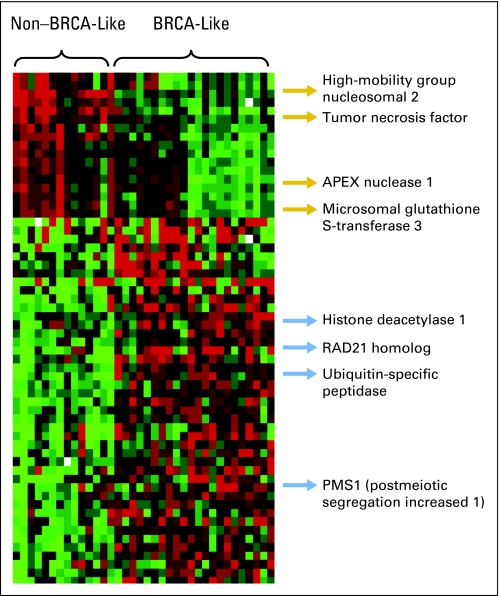
Fig 1.
Expression plot of the 60 genes that comprise the BRCAness profile. Columns represent set samples; rows, gene expression levels (normalized). Complete information regarding gene identity is provided in Appendix Table A1. Red indicates overexpressed genes; green, underexpressed genes. The gene expression signature that correlates with BRCA-like tumors is defined as the BL profile, and the signature that correlates with non–BRCA-like tumors is defined as the NBL profile.

