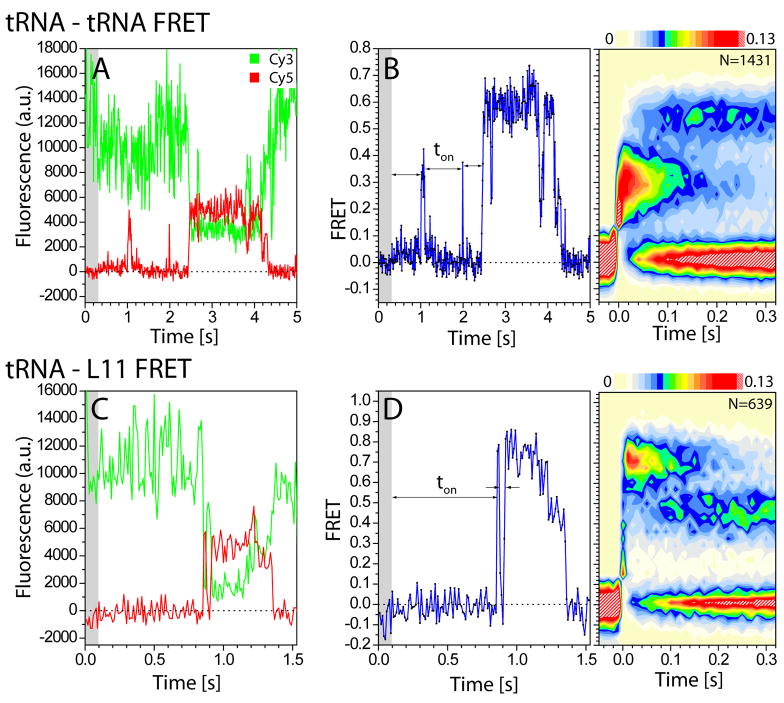
Figure 2. Single-molecule observations of aa-tRNA selection monitored from two distinct structural perspectives.
(A) Single-molecule fluorescence trajectories (Cy3, green; Cy5, red) obtained during the delivery of ternary complex with Cy5-labeled aa-tRNAPhe to ribosome complexes containing Cy3-labeled P-site tRNAfMet. (B, left panel) The corresponding FRET trajectory is shown in blue. The interval preceding stopped-flow injection of ternary complex is indicated (grey shaded area). The interval until the first observation of FRET (ton) reflects the bimolecular rate constant (~140μM−1s−1) at ~10nM aa-tRNA. (B, right panel) SmFRET trajectories are post-synchronized to the first observation of FRET above the noise threshold (0.13 FRET), and combined into two-dimensional histograms shown here as a contour plot. The contour plot color map reveals the probability distribution of FRET values at each time point (white-low probability; red-high probability). (C) Single molecule fluorescence trajectories (Cy3, green; Cy5, red) obtained during the delivery of ternary complex with Cy5-labeled aa-tRNAPhe to ribosome complexes containing Cy3-labeled L11. (D, left panel) The corresponding FRET trajectory is shown in blue. (D, right panel) Two-dimensional FRET histograms of the raw data created by superimposing each individual FRET trajectory to the data point at which FRET crossed the threshold of 0.13.

