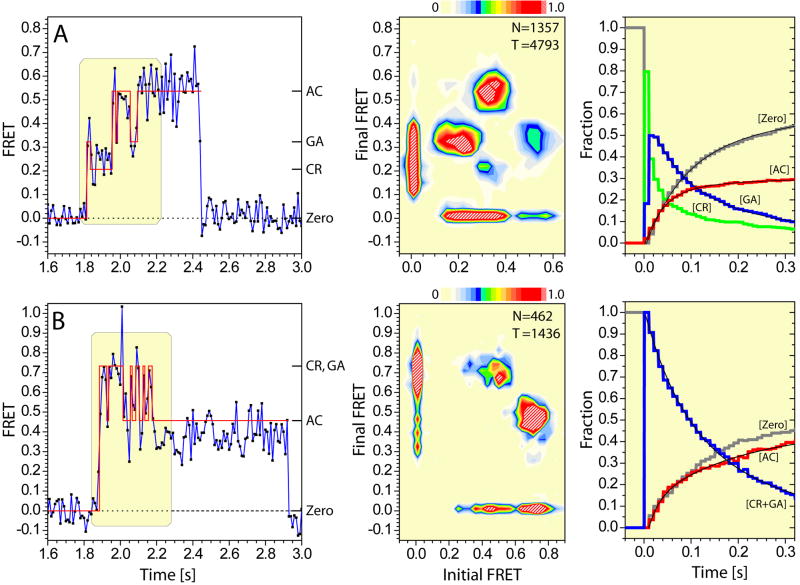
Figure 4. smFRET trajectories reveal the order and timing of structural transitions during aa-tRNA selection.
(A, left panel) smFRET trajectory (blue) resulting from the delivery of ternary complex containing Cy5-labeled aa-tRNAPhe to ribosomes containing labeled P-site tRNAfMet, with idealization generated using hidden Markov Modeling (HMM) overlaid in red. FRET values corresponding to the CR (low), GA (intermediate) and AC (high) states are indicated. The boxed region shown represents the completed tRNA selection event. (Center panel) The transition density plot (TDP) indicates the distribution of transitions between the three observed FRET states. The asymmetry of the TDP with respect to the diagonal axis reflects the pre-steady state nature of the observation. (Right panel) The time evolution of the occupancy in each observed FRET state reveal the order and timing of events in the selection process; zero FRET (grey); CR (green); GA (blue); AC (red). (B) The corresponding analysis of FRET trajectories observed on L11-labeled ribosome complexes.

