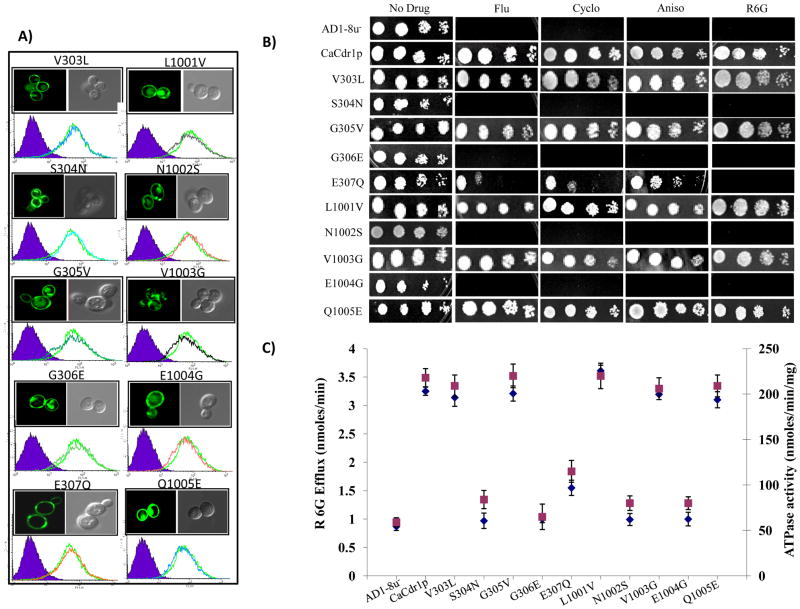
Fig. 3.
Equipositional replacements of the Signature sequences of CaCdr1p. A). Fluorescence imaging (upper panel) by confocal microscope showing membrane localization of CaCdr1p and its mutant variant protein expressing cells. Flow cytometry (lower panel) of S. cerevisiae cells expressing WT-CaCdr1p and its mutant variants. The histogram derived from the cell quest program depicts fluorescence intensities for AD1-8u-(control) (purple filled area) and WT-CaCdr1p (solid orange line) for each panel, and the other extra line represents the respective CaCdr1p mutant variant-expressing cells. B). Drug resistance profile of WT-CaCdr1p and its Signature motif mutant variants was determined by spot assays as described for Fig 2. C). R6G efflux (left Y-axis) indicated by blue diamond (◆) and oligomycin sensitive ATPase activity (right Y-axis) of WT-CaCdr1p with its mutant variants indicated by green square ( ) [34, 37].

