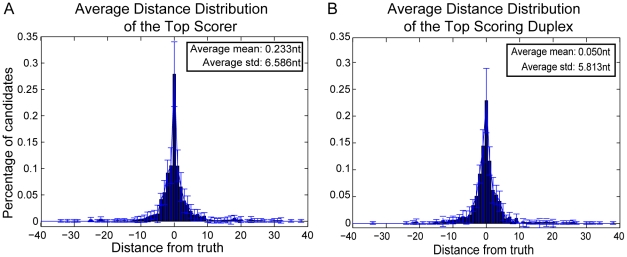
Figure 4. Average distance distributions of Top Scorer and Top Scoring Duplex over the 10-fold cross validation.
A. The average distance distribution of the Top Scorer is estimated separately for each stem of the miRNA precursors, using only the stems that contain an actual miRNA. This approach assumes prior knowledge of the functional stem(s). B. The average distance distribution of the Top Scoring Duplex is estimated over both stems of the miRNA precursors. The distribution is generated by calculating for each precursor the distance of the actual mature miRNA(s) from the predicted candidate (miRNA or miRNA*) that is located on the same stem.

