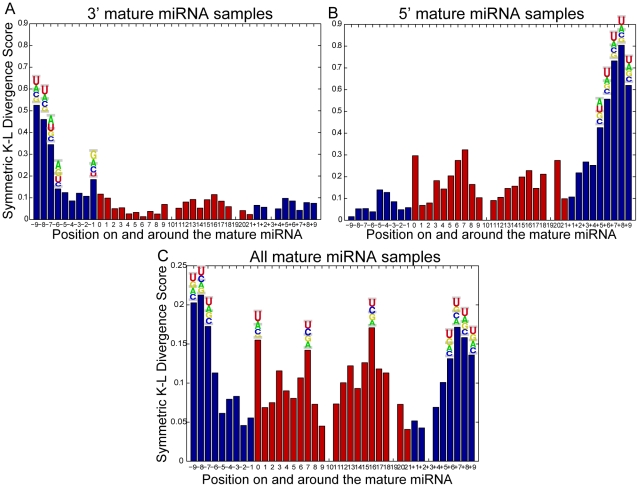
Figure 8. Position-specific feature distributions.
All distributions are estimated according to the Kullback–Leibler divergence score over the training set. Red indicates positions within the mature miRNA while blue indicates positions surrounding the mature miRNA. A, B. Feature distributions for the 3′ and 5′ mature miRNAs respectively. C. Feature distributions for the combined data set, including both 3′ and 5′ mature miRNAs. Sequence composition information is also provided for the 10 top scoring position-specific features. Note that top scoring features tend to cluster in positions 7–9 nucleotides before the start position of the mature miRNA for 3′ samples and after the 22nd nucleotide (representing the average end position) of the mature miRNA for 5′ samples. For the combined data set shown in C, the most informative position-specific features lie symmetrically in both ends of the mature miRNA flanking regions. All of the above features are most likely to contain a U base except the 7th position in 3′ samples where the probability of containing Adenine is slightly higher.

