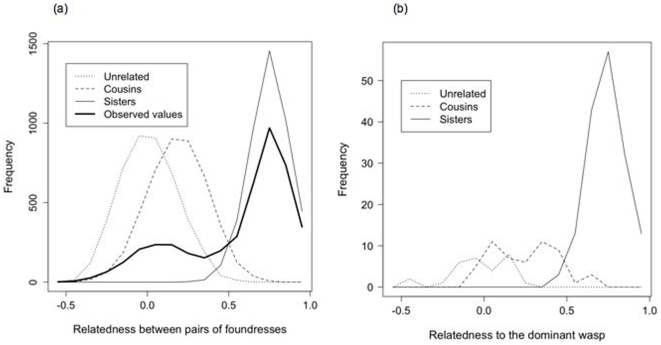
Figure 2. Relatedness in the study population and sample.
a) Distribution of pairwise nest-mate relatedness across whole population, based on a sample of 4396 cofoundress pair (broad line). Further lines represent pairwise relatedness from simulated populations comprising 4396 pairs of sisters, cousins, and unrelated wasps b) Distribution of relatedness to the dominant wasp for subordinates classed as sisters of the dominant, cousins of the dominant, and non-relatives, on nests used for behavioural observations. Categories overlap because allocations are based on pairwise likelihoods, which depend on the population allele frequencies, and not absolute cut-off values. For example, an individual that is related to the dominant by less than 0.1 might be found to be more likely a cousin than unrelated, if the particular alleles that the two individuals do share are rare in the population.

