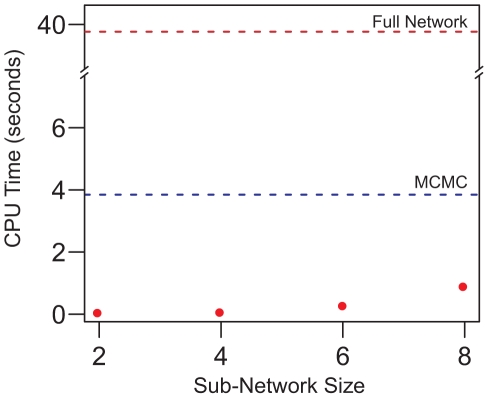
Figure 3. Average CPU time taken for calculating the pseudo-likelihood on toy networks.
The pseudo-likelihood of going from the network  to the network
  (Figure 1) was calculated conditioned on
  for different sub-network sizes. The times taken for calculating the pseudo-likelihood averaged across three runs are shown in red. The horizontal lines show the average CPU time taken using the MCMC approach based on path sampling described in Mithani et al.
[9] with 11,000 iterations including first 1,000 iteration as burn-in period (blue dashed line) and by exponentiating the full network (brown dotted line).

