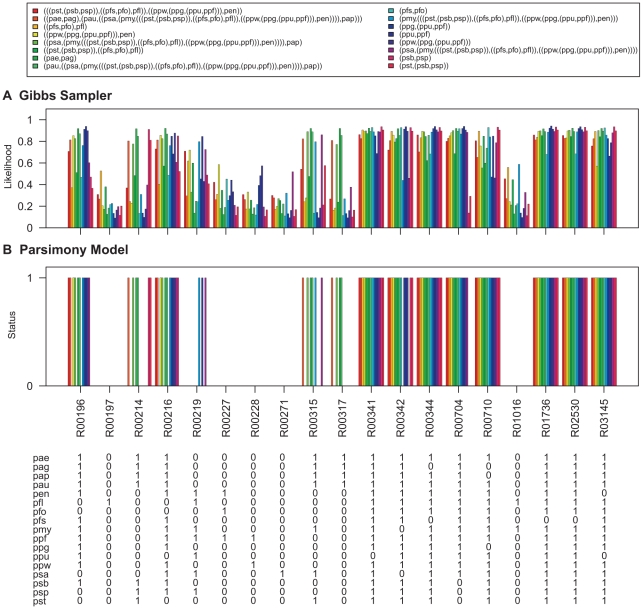
Figure 12. Ancestral network reconstruction for the pyruvate metabolism map.
The ancestral networks were reconstructed over the Pseudomonas phylogeny shown in Figure 6A. Also shown in the bottom panel is the distribution of reactions across different Pseudomonas strains. (A) Likelihood of being present for alterable reactions at various levels of Pseudomonas phylogeny obtained by calculating the proportion of times each hyperedge was present in the networks sampled by the Gibbs sampler. (B) Reaction status obtained under maximum parsimony calculated using the Fitch algorithm [26]. When assigning the reactions at the ancestral nodes the ties were resolved in favor of presence of reactions. Strain abbreviations: pae: P. aeruginosa PAO1, pap: P. aeruginosa PA7, pau: P. aeruginosa PA14, pag: P. aeruginosa LESB58, pen: P. entomophila L48, pfl: P. fluorescens Pf-5, pfo: P. fluorescens Pf0-1, pfs: P. fluorescens SBW25, pmy: P. mendocina ymp, ppf: P. putida F1, ppg: P. putida GB-1 ppu: P. putida KT2440, ppw: P. putida W619, psa: P. stutzeri A1501, psb: P. syringae pv. syringae B728a, psp: P. syringae pv. phaseolicola 1448A, and pst: P. syringae pv. tomato DC3000.

