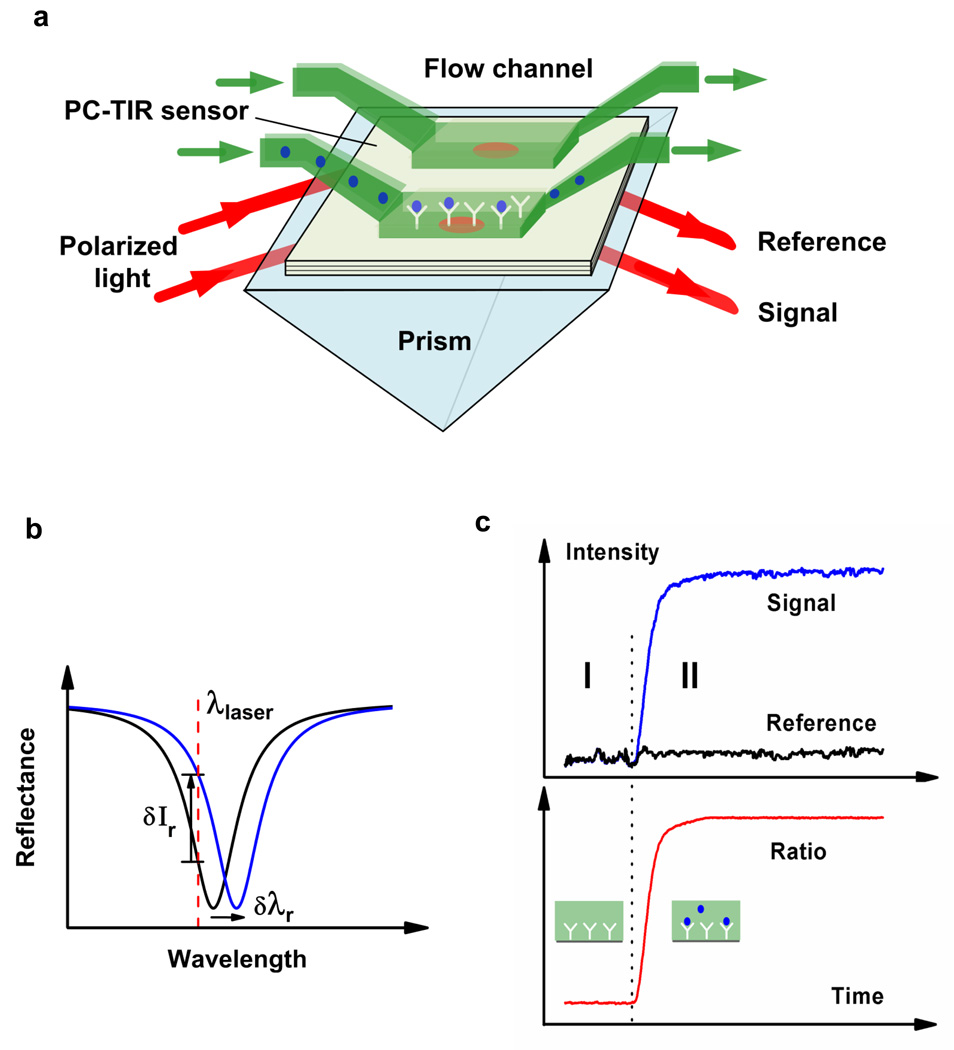
Figure 1.
Concept of PC-TIR sensor measurement. (a) Schematic sensor configuration showing identically polarized beams from the same light source incident on separate signal and reference channels. (b) The resonance mode shift can be monitored by directly observing the reflectance spectrum or by measuring the reflected intensity change at a laser wavelength. (c) Binding kinetics monitored by the reflected signal intensity and by the normalized intensity ratio, where region I is the baseline with ligand on the surface, and region II reflects real-time analyte binding to ligand.

