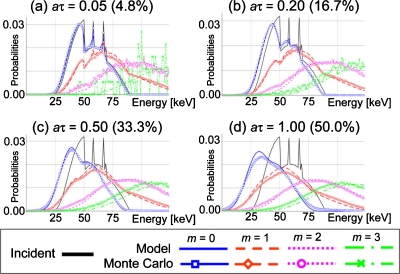
Figure 11.
The PDFs of the recorded spectrum for mth order pileup Pr(E|m), with 90 kVp polychromatic input x-ray spectrum at various relative count rates aτ, obtained using the model and Monte Carlo simulations. Numbers in parentheses are count rate loss ratio 1−Pr(rec|aτ) (%). Oscillations in Monte Carlo results (e.g., m=3 with aτ=0.05) were due to a limited number of cases (counts).

