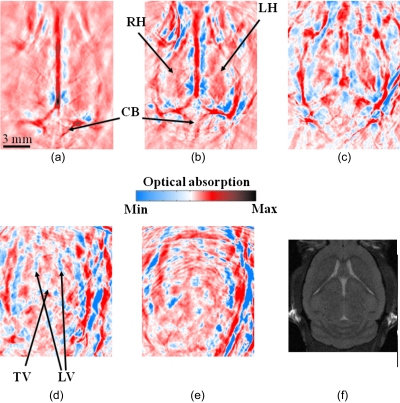
Figure 2.
In situ 3-D mouse brain images obtained by the curved array photoacoustic tomography system. The images show horizontal cross sections from the dorsal to the ventral part of the brain, where the imaging depth is (a) 0 mm, (b) 2.0 mm, (c) 4 mm, (d) 6 mm, and (e) 8.0 mm from the top surface of the mouse’s brain, with an interval of 2 mm. Major tissue structures are indicated on the images. An MRI image at a similar depth as (d) is shown in (f). The color bar shows the relative magnitude of optical absorption. CB: cerebellum; RH: right hemisphere; LH: left hemisphere; LV: lateral ventricle; TV: third ventricle. (Color online only.)

