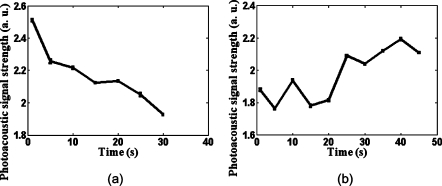
Figure 4.
Rat brain cortex hemodynamics with the curved array transducer. (a) The photoacoustic signal strength change on the rat brain cortex when the physiological status changed from normoxia to hyperoxia; (b) the photoacoustic signal strength change when the physiological status changed from hyperoxia to normoxia. The laser wavelength was 771 nm. The error bars are the standard errors at each measurement point.

