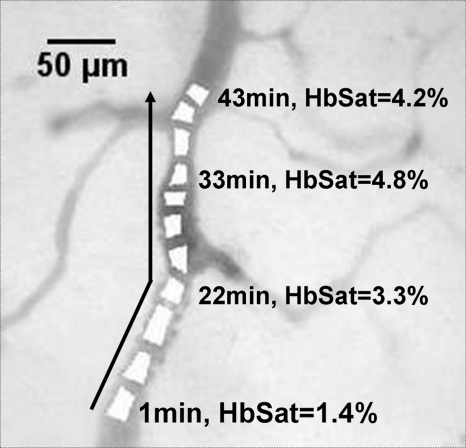
Figure 11.
Detail of highlighted region in Fig. 10 showing the progression of the RBC occlusion front during the imaging session (arrow). The RBC occlusion front progressed counter to the direction of blood flow in the vessel. The occlusion front was chosen by identifying an area within the HbSat gradient in the occlusion vicinity where the HbSat decreased to a level less than 5%. The HbSat values of several ROIs on the apparent occlusion front at different time points are indicated in the figure.

