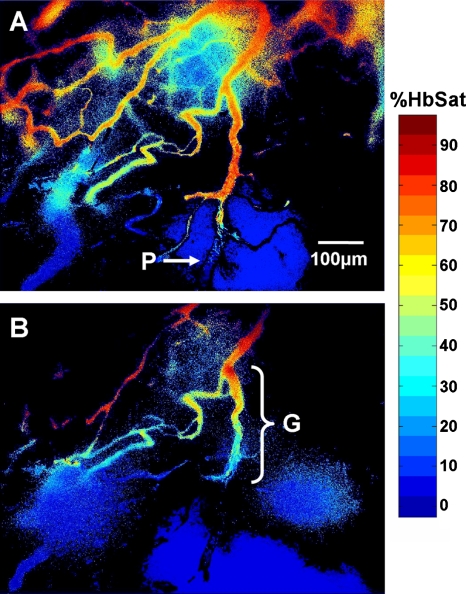
Figure 12.
Hemoglobin saturation maps of the tumor microvessel network in Fig. 10 at two different time points. The images were taken at (a) 5 and (b) 60 min into the imaging session. The plug (P) is indicated in (a). Note the sharp change in vessel oxygenation at the plug relative the perfused region upstream of the occlusion. A steep vessel oxygenation gradient (G) is seen in near the plug as the plug advances in the vessel in (b).

