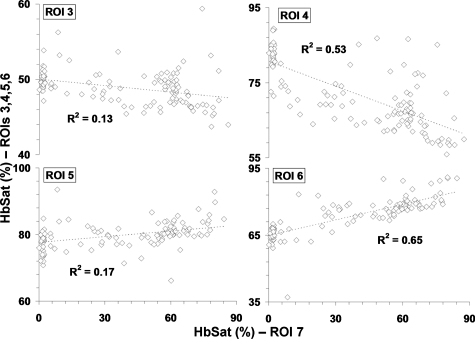
Figure 4.
Plot of vessel with ROI 7 HbSat measurements (abscissas) versus vessels with ROIs 3 to 6 (ordinates) in Fig. 1 for the time points over the 43-min imaging session with data sets acquired every 20 s. The specific ROI being compared to ROI 7 is indicated in each graph. A line was fit to the data to gauge the correlation between the oxygenation in the vessels and R2 values of the linear fit are indicated in the figure.

