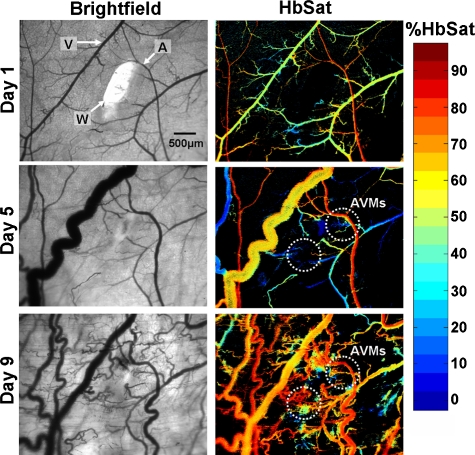
Figure 5.
AVM development in a conditional Alk1 deletion mouse (ROSA26CreER∕Alk12f∕−) stimulated by a wound, where A, arteriole; V, venule; and W, wound. The left column shows transmitted light images and the right column shows HbSat images. Region where AVMs formed is indicated in the day 5 and day 9 images. At day 5, the AVM connections were not obvious but clear changes in venule oxygenation could be seen due to the AVMs. The arrowheads indicating the arteriole and venule also indicate regions of interest where HbSat measurements were obtained.

