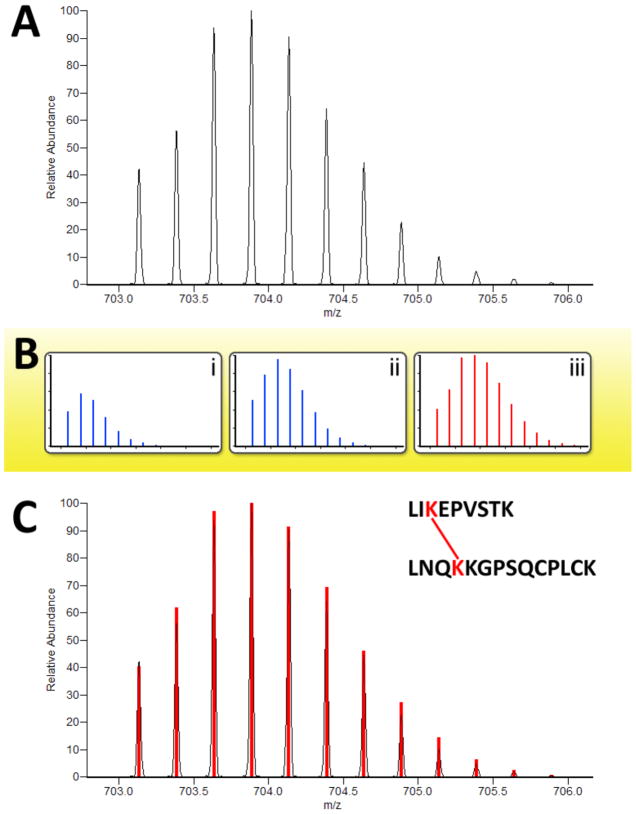
Figure 3.
Identification of crosslinked peptide isotope distributions. A candidate peptide isotope distribution (A) is analyzed by Hardklör. Possible isotope signatures are modeled for (B-i) natural isotope abundance, (B-ii) 18O2, and (B-iii) 18O4 containing peptides. A best match to an 18O4 containing peptide (C) indicates an interpeptide crosslink whose sequences are then identified by PepLynx.

