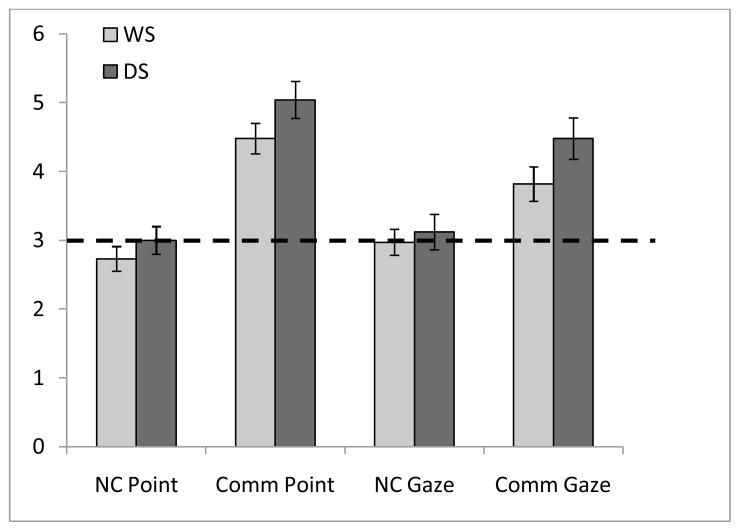
Figure 2.
Number of trials correct for each condition relative to chance performance as a function of diagnostic group. Error bars represent standard error of the mean and dotted line indicates chance level of performance. WS = Williams syndrome; DS = Down syndrome; NC = Non-communicative; Comm = Communicative.

