
Figure 4.
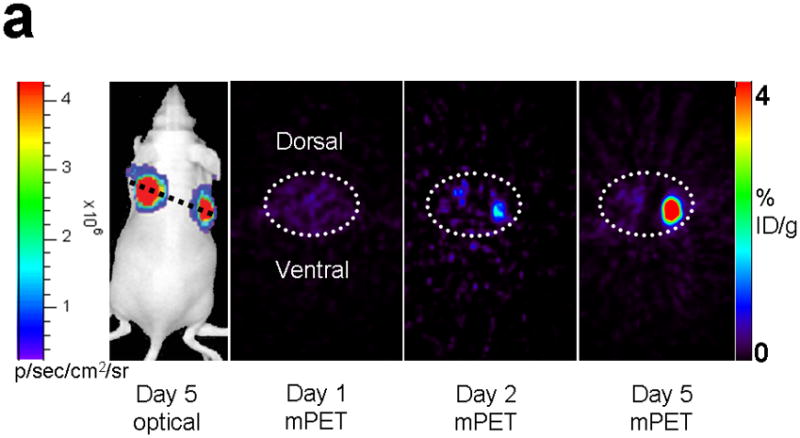
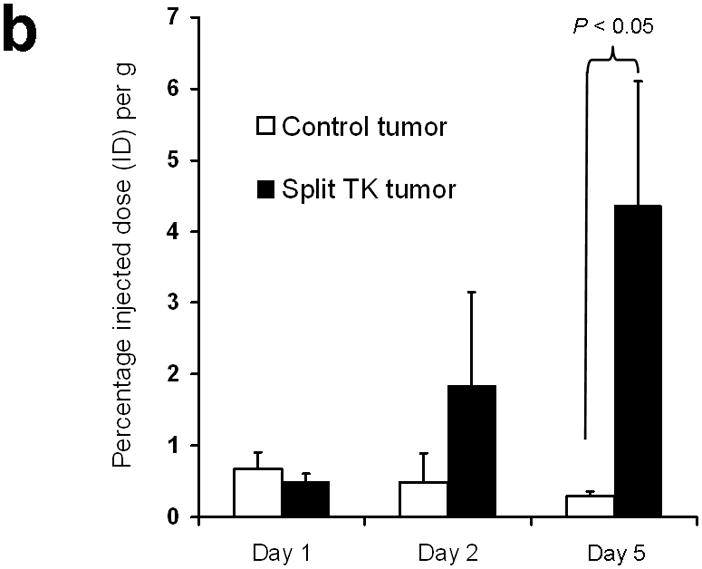
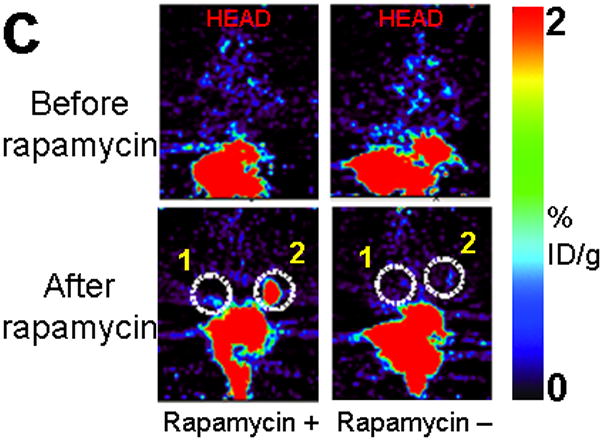
Imaging of tumors containing the split TK constructs. (a) Transaxial tomographic microPET images through a representative prone-positioned mouse implanted subcutaneously over the left shoulder with mock transfected 293T cells, and over the right shoulder with 293T cells stably expressing both nTK(V119C)-FRB and FKBP12-cTK. The mouse was injected with 200 μCi of [18F]-FHBG prior to imaging on days 1, 2, and 5 into the imaging protocol (i.e., after 7 days of initial xenograft growth). Elliptical dotted white line outlines the surface of the mouse’s upper thorax. Color intensity is a reflection on probe accumulation after its phosphorylation by the complemented TK enzyme. Quantitative analysis of this probe accumulation shows a mean %ID g−1 (obtained from 5 tomographic slices through each tumor for all animals) as displayed in accompanying graph (b). The difference between accumulation in tumors exhibiting split TK complementation and control tumors was statistically significant (P = 0.02) on Day 5. Also shown is the optical CCD imaging on day 5 of the imaging protocol of the same mouse immediately before its subsequent microPET imaging of bilateral shoulder region subcutaneous xenografts, and is shown as a visible light image superimposed on the CCD bioluminescence image with a scale in photons/sec/cm2/steradian. Mice were imaged in the prone position after tail-vein injection of 4 mg D-Luciferin per animal. Each mouse was implanted subcutaneously over the left shoulder with 5 × 10⁶ mock transfected 293T cells admixed with 50,000 293T stable cells expressing Firefly luciferase, and subcutaneously over the right shoulder with 5 × 10⁶ 293T stable cells expressing both nTK(V119C)-FRB and FKBP12-cTK admixed with 50,000 293T stable cells expressing Firefly luciferase. Bioluminescence imaging shows equivalent viable tumor load in both xenografts. Angeled black dotted line shows the transaxial plane, bisecting each tumor, through which the microPET images were obtained. (c) Coronal tomographic microPET images through two representative prone mice implanted subcutaneously over the left shoulder (circle 1) with control tumors of 293T cells stably expressing nTK plus cTK only (in a single vector), and over the right shoulder (circle 2) with 293T cells expressing nTK(V119C)-FRB plus FKBP12-cTK in a single vector. Unlike tumors containing the complemented TK enzyme, there was minimal FHBG accumulation (%ID g−1) in the control tumors on the fifth day of the imaging protocol upon systemic administration of rapamycin (see text). Intense accumulation in centre of image is due to non-specific probe excretion in the gut.