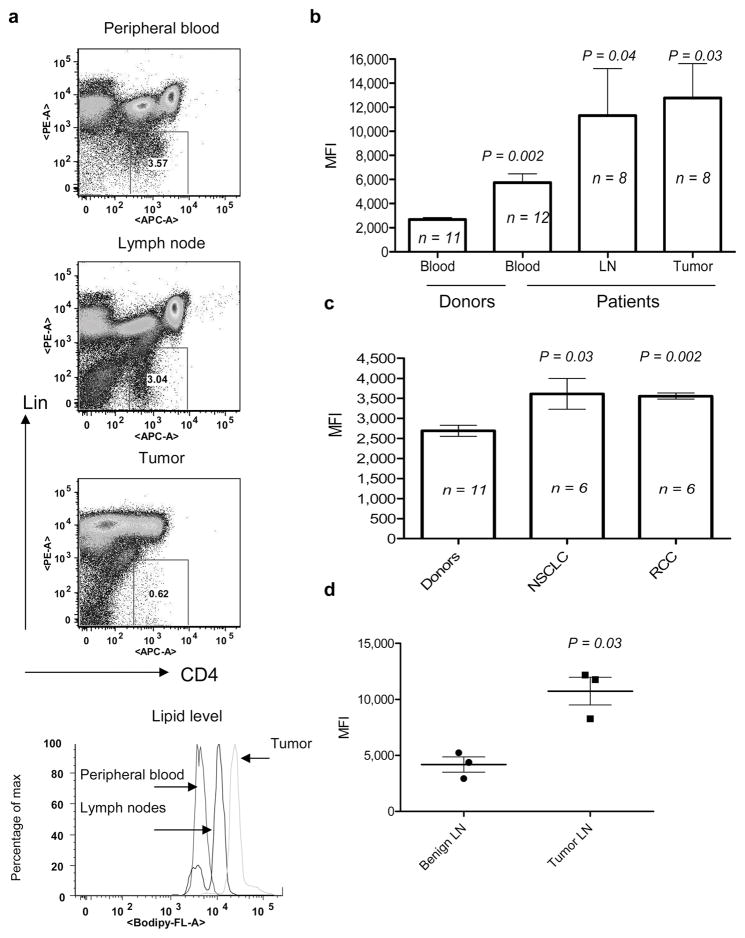
Figure 2. Lipid level in DCs from cancer patients.
a. Typical example of Bodipy staining of DCs from cancer patient. b. Cumulative results of lipid levels in DCs from patients with head and neck cancer. P values between the levels of lipids in blood DCs from control donors are shown; n = the number of samples analyzed. c. Lipid levels in peripheral blood DCs from patients with non-small lung cancer (NSCLC) and renal cell cancer (RCC). P values between the levels of lipids in blood DCs from control donors are shown n = the number of samples analyzed. d. Lipid levels in DCs from lymph nodes obtained from patients with head and neck cancer and benign tumors. P values between the levels of lipids in DCs from cancer patients and patients with benign tumors.

