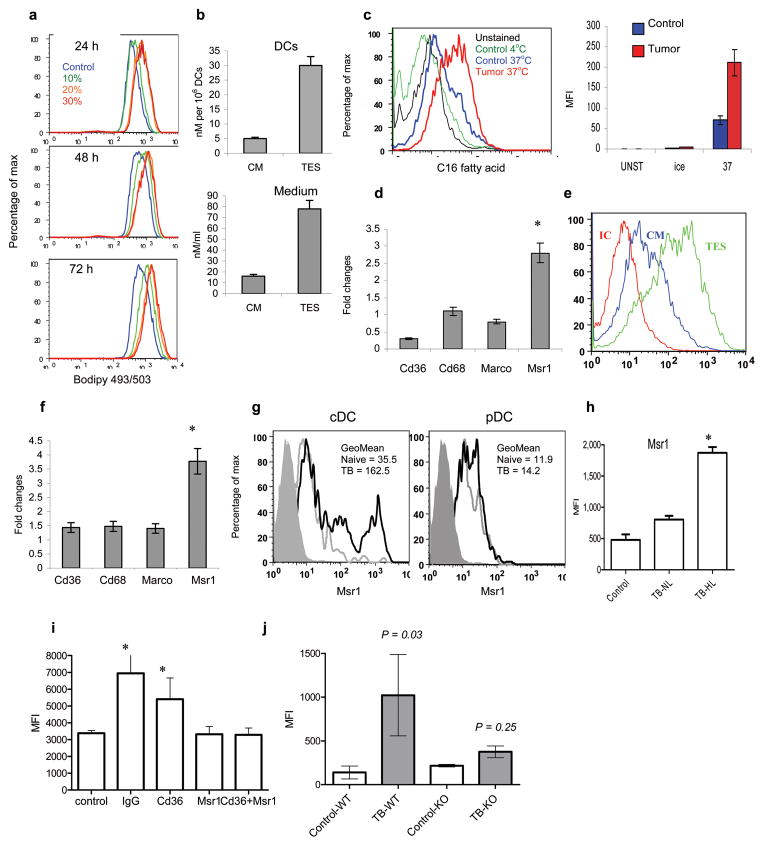
Figure 3. The mechanism of lipid accumulation in DCs.
a. Lipid level in DCs generated from enriched BM HPC and cultured in the presence of different concentrations of TES for indicated period of time. b. The total level of TAG using ESI-MS in CD11c+ DCs generated from BM HPC in the presence of 20% TES. Measurements were performed in triplicate. c. Uptake of fluorescently labeled C16 fatty acid by DCs generated from BM HPC and cultured for 24 hr with control medium or TES. The left panel is a typical example of staining after 30 min incubation with C16 fatty acid. The right panel shows cumulative results of 3 performed experiments (Mean±SD). Ice – cells incubated with fatty acid at 4°C; 37°C – cells incubate with fatty acid at 37°C. d. Gene expression of indicated SR in DCs cultured for 48 h with control medium or TES. Samples were evaluated in triplicate by qRT-PCR and the results were normalized to the level of expression of β-actin. The fold changes between DCs generated with TES and control were calculated. The results of from 3 performed experiments are shown. e. Expression of Msr1 on the surface of DCs cultured with control medium (CM) or TES. IC – isotype control. The typical examples of three performed experiments are shown. f. Gene expression of indicated scavenger receptors in DCs from naïve and EL-4 TB mice by qRT-PCR. The results were normalized to the level of expression of β-actin. Fold changes between EL-4 TB DCs and control DCs were calculated. The results of 3 performed experiments are shown. g. Expression of MSR1 within the population of conventional (cDC) or plasmacytoid (pDC) spleen DCs from naïve and EL-4 TB mice. Shaded histogram – isotype control; grey line – naïve mice, bold black line – TB mice. h. Expression of MSR1 in spleen DCs with normal lipid content (TB-NL) and high lipid content (TB-HL) from EL-4 TB mice. Control – DCs from control mice. Mean ± SD of 4 performed experiments are shown. * - statistically significant differences (p<0.05) from values in control DCs. Fluorescence of cells labeled with isotype control IgG was less than 20 in all samples. i. Lipid level in DCs generated in vitro and cultured for 3 days with TES in the presence of control IgG, or indicated antibodies against scavenger receptors. Mean ± SD from three experiments is shown. * - statistically significant differences (p<0.05) from values in control DCs. j. Lipid levels in DCs generated from enriched BM HPC of wild-type (WT) or MSR1 knockout (KO) C57BL/6 mice and transferred i.v. into sub-lethally irradiated congenic tumor-free (control) or EL-4 TB (TB) recipients. Lipids were measured in donor’s cells isolated from spleens of recipients two days after the transfer. Each group includes 4–8 mice. Geometric mean of fluorescence is shown. P values between control and TB mice were calculated using two-tailed Mann-Whitney test.

