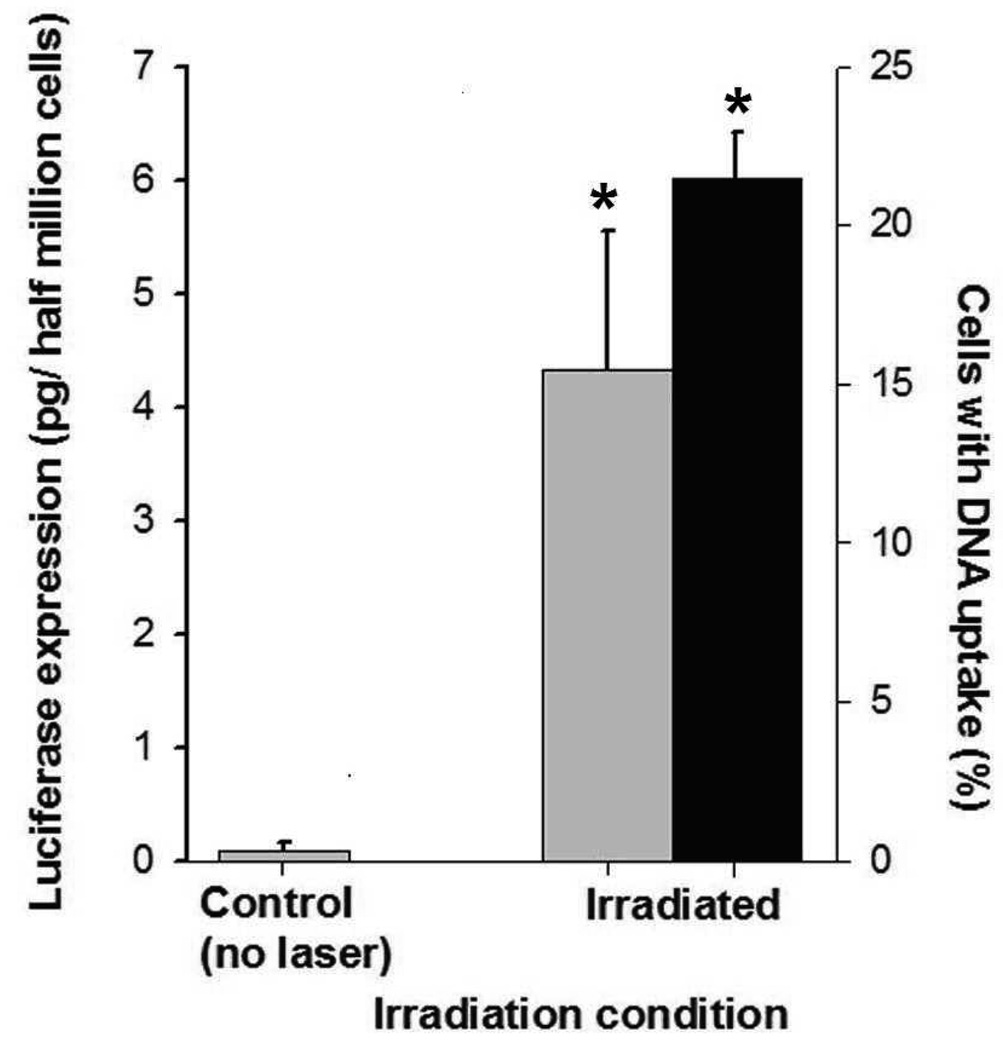
Figure 3.
Uptake and expression of plasmid DNA. The graph shows intracellular uptake (■) and transfection ( ) of luciferase plasmid DNA in DU145 cells. Uptake of YOYO1-labeled plasmid DNA was assayed < 2h after irradiation to assess intracellular delivery of DNA molecules. Luciferase expression was measured 48h after irradiation to assess expression of the luciferase protein encoded in the DNA. Each sample had 5×10⁵ cells and 30µg/ml CB. Irradiation was carried out at 5mJ/cm2 for 10 min. Non-irradiated controls were identical to irradiated samples, except no laser irradiation was applied. Data show average (n=3) ± SEM. *p<0.05 for treated cells compared to non-irradiated negative control.

