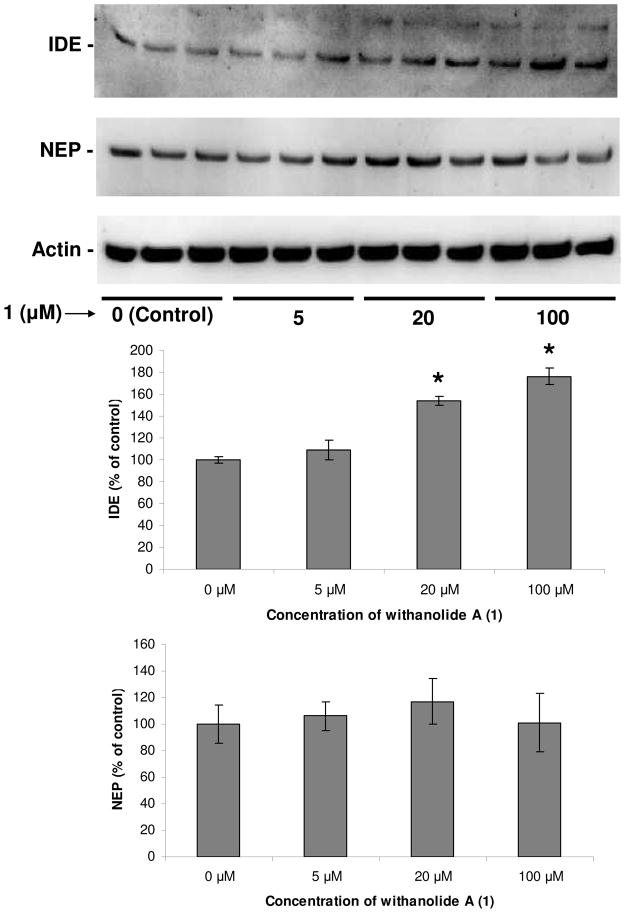
Figure 5.
Dose-dependent effects of withanolide A (1) on targets involved in Aβ degradation (IDE and NEP). Cortical neurons were treated with 0, 5, 20 and 100 μM of 1 for 24 h. Immunoblots show significant up-regulation of IDE, while NEP remained unaffected, in neurons treated with 1 in a dose-dependent manner as compared to controls. Histograms corresponding to IDE and NEP blots represent quantitative determinations of intensities of the relevant bands normalized to actin. Data represent mean ± S.D. of three independent experiments. The Student’s t-test was used for analyzing the differences between the two treatment groups (*, p <0.05 compared with respective control).

