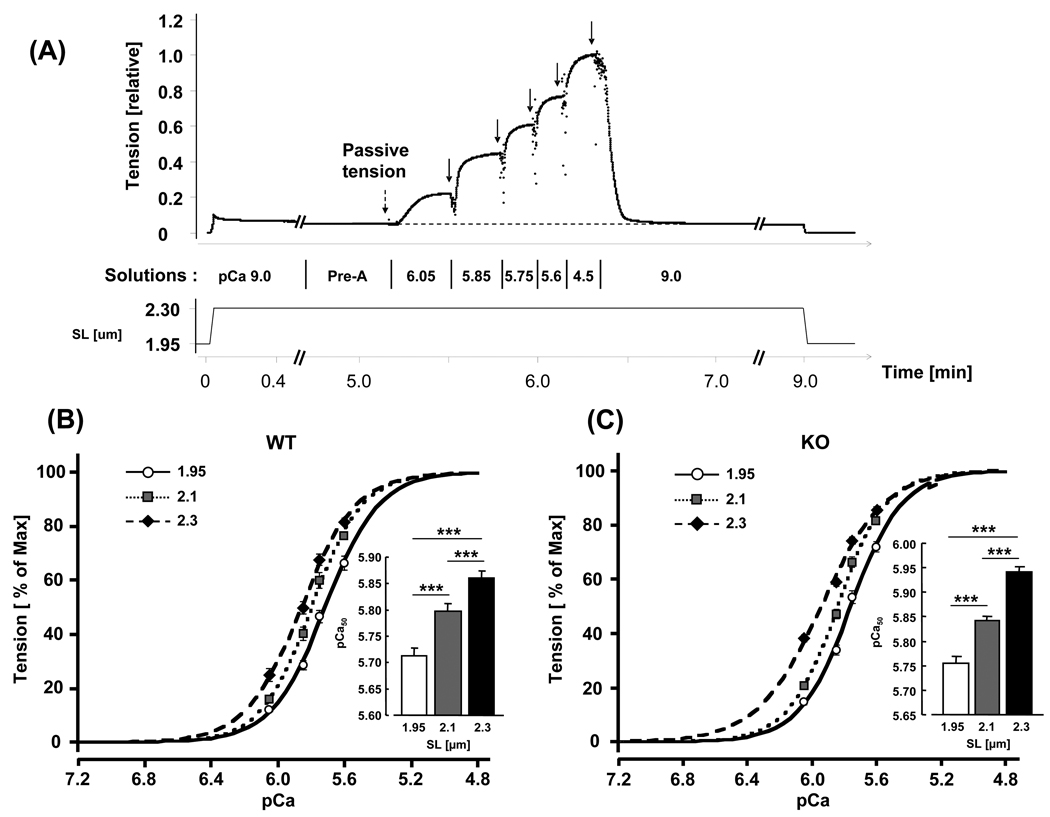
Figure 3. Force–pCa relations in WT and N2B KO skinned myocardium.
(A) Explanation of experimental protocol. The preparation was stretched, held for 9 min and then released. During the hold phase, the muscle was first in relaxing solution (pCa ~9.0), followed by pre-activating solution (Pre-A) and pCa 6.05, 5.85, 5.75, 5.6, 4.5 activating solutions, and finally relaxing solution again. Passive tension was measured just prior to activation and active tension in each activating solution was measured from the steady-state tension (arrows) minus passive tension. Active tensions were normalized by the maximal active tension at pCa 4.5. (B and C) Average tension-pCa curves and pCa50 (inset) of WT (B) and KO (C) at SL 1.95, 2.1, and 2.3 µm. In both genotypes, increasing sarcomere length left-shifts the tension-pCa curves and increases pCa50 values. Results from 8 WT and 8 KO mice. Asterisks: comparison between different sarcomere lengths in each genotype.

