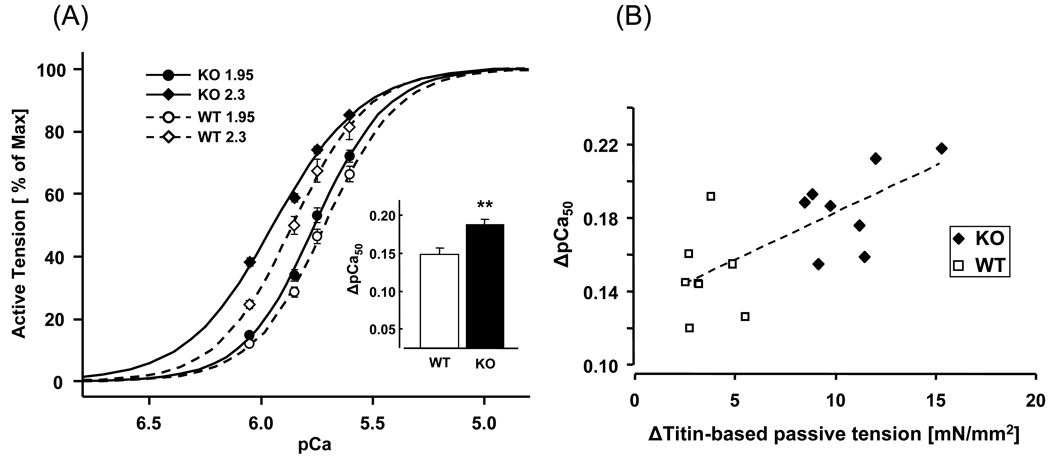
Figure 5. Length dependence of activation in WT and N2B KO skinned myocardium.
(A) Average tension-pCa curves of WT (open symbols) and KO (closed symbols) at SL 1.95 and 2.3µm. Inset, ΔpCa50 values (asterisks: comparison between WT and KO). (B) ΔTitin-based passive tension is significantly correlated with LDA (ΔpCa50 from SL1.95 to 2.3µm) in WT (open symbols) and KO (closed symbols) myocardium. Dashed line is the linear regression fit (p<0.002). Results from 8 WT and 8 KO mice

