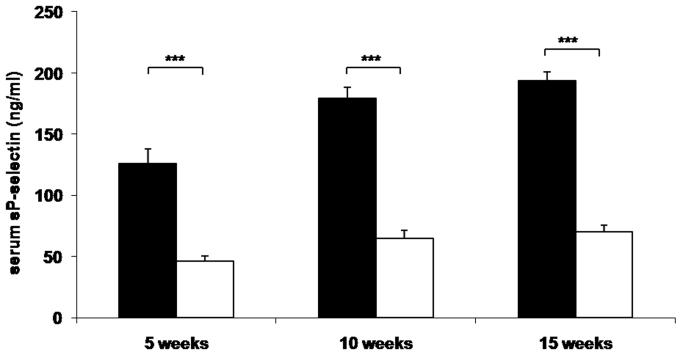
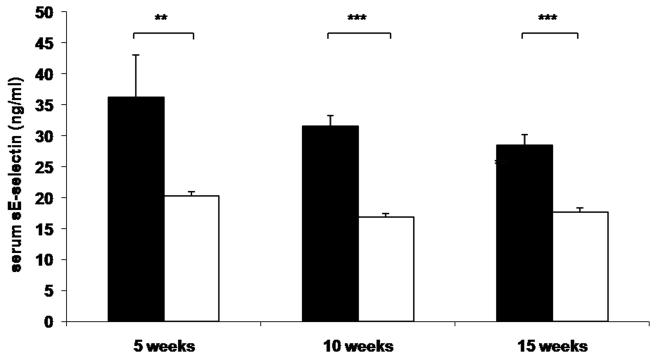
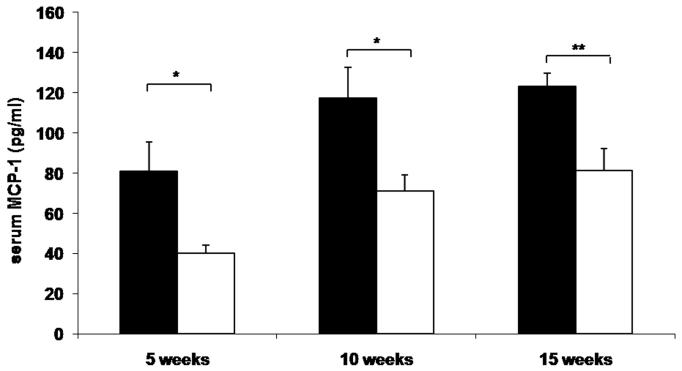
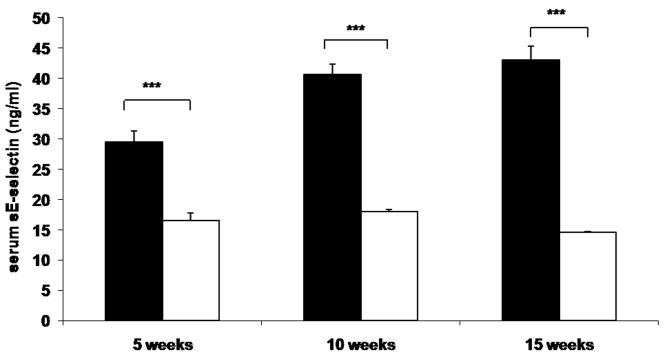
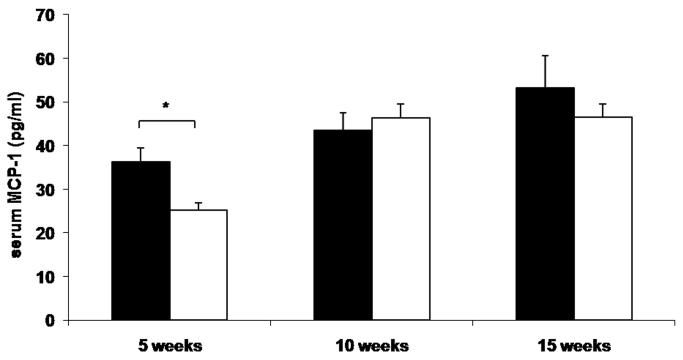
Figure 1. Circulating sP-sel, sE-sel, and MCP-1 at 5, 10, and 15 weeks of age.
Leprdb/db,Psgl-1+/+ (black bars) and Leprdb/db,Psgl-1−/− mice (white bars). Five week time point for Leprdb/db,Psgl-1+/+ mice (n=5-7). All other time points for Leprdb/db,Psgl-1+/+ and Leprdb/db, Psgl-1−/− mice (n=7-13). A) sP-sel levels. B) sE-sel levels. C) MCP-1 levels. Psgl-1+/+ (black bars) (n=5) and Psgl-1−/− mice (white bars) (n=3-5) on high-fat, high-sucrose diet. D) sP-sel levels. E) sE-sel levels. F) MCP-1 levels. *p<0.05, **p<0.01, ***p<0.001.

