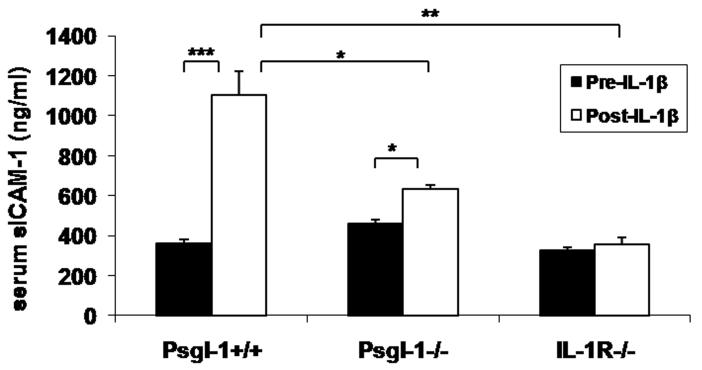
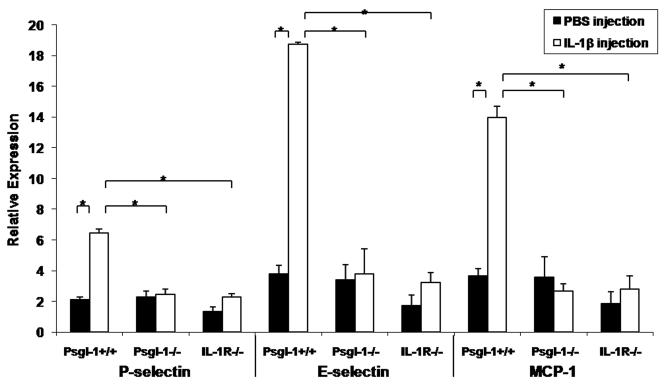
Figure 3. Circulating sP-sel, sE-sel, MCP-1, and sICAM-1 and expression of P-sel, E-sel, and MCP-1 in lung and perigonadal fat 5 hours following IL-1β injection.
Psgl-1+/+ (n=4), Psgl-1−/− (n=3), and IL-lR−/− mice (n=3). A) sP-sel levels, B) sE-sel levels, C) MCP-1 levels, and D) sICAM-1 levels in Psgl-1+/+, Psgl-1−/−, and IL-lR−/− mice before IL-1β challenge (black bar) and after IL-1β challenge (white bar). Expression of P-sel, E-sel, and MCP-1 in Psgl-1+/+, Psgl-1−/−, and IL-lR−/− in E) lung and in F) perigonadal fat following PBS injection (black bar) and following IL-1β challenge (white bar). * p<0.05, **p<0.01, ***p<0.001.


