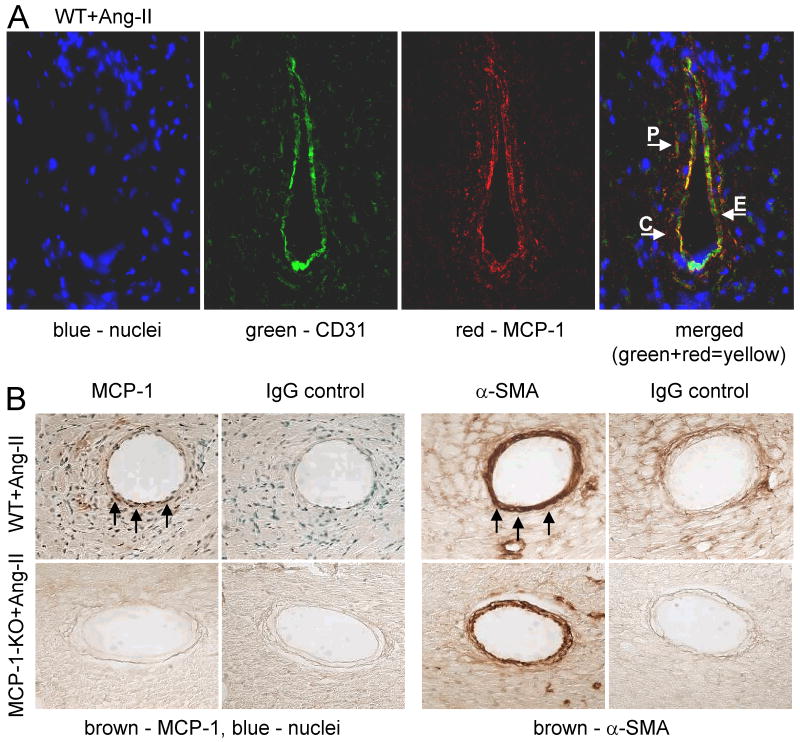
Fig. 2. MCP-1 expression is found around small vessels.
(A) 2 wks Ang-II-infused WT heart tissue was simultaneously stained for MCP-1 (red) and CD31 (green) to identify endothelial cells (the overlap of both colors in the merged image results in yellow). Blue represents DAPI-stained cell nuclei (image magnification: ×400). MCP-1 was detected on the surface of endothelial cells (arrow E) and pericytes (arrow P), as well as on CD31- cells in close proximity to the vessel (arrow C). Positive MCP-1 staining was not associated with Mac-2 (images not shown), indicating that CD31-/MCP-1+ cells were not macrophages. MCP-1 was not detected in areas distant from vessels and/or interstitially. (B) Adjacent perfusion-fixed heart tissue sections were stained for either MCP-1 or α-SMA using a peroxidase-based color (brown; arrows) development system (image magnification: ×400). Selected slides were counterstained with methyl green that identifies cell nuclei (blue). MCP-1+ cells were found within the media (α-SMA+ region) of small vessels of Ang-II-infused WT, but not MCP-1-KO mice (or saline-treated mice – not shown).

