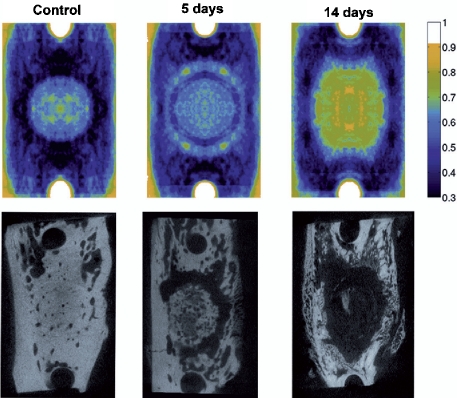
Figure 7.
Superimposed microCT scans illustrating the average distribution of the osteolytic response (top). To produce the pictures, 9-10 scans from 9–10 different rats in each group were used and two symmetry axes imposed so that each point represent 36–40 experimental values. Here, darkest magenta represents solid bone, cyan, green and yellow represent increasing osteolysis and white represents absence of bone. Typical samples for illustration of specific bone scans below.

