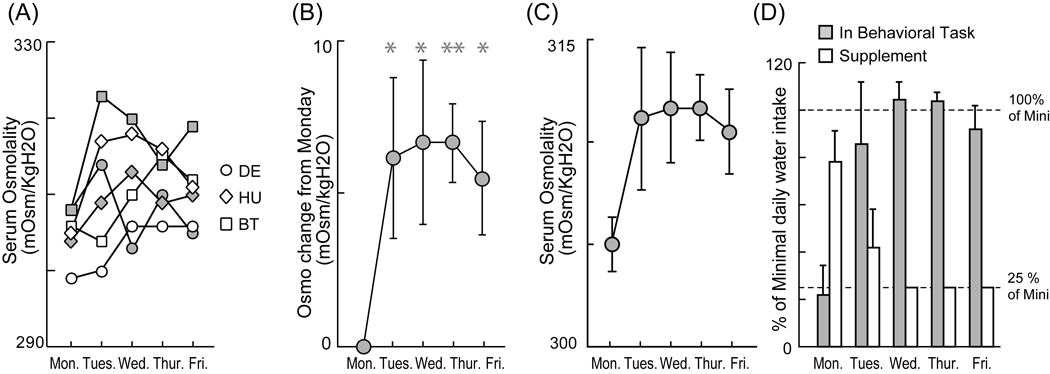
Fig. 1. Increase of serum osmolality across a week.
(A) Plots of serum osmolality across a week. Two series of samples for each of three monkeys are represented. (B) Plot of average change in serum osmolality from Monday baseline. (C) Plot of average serum osmolality across a week. * and **: P < 0.05 and P < 0.01 by two sample t-test against Monday level. Error bars indicate standard errors of the mean. (D) Plot of average daily water intake in the behavioral task and out of the task. (Note: The large Friday evening water supplement is not shown here.). The plots were normalized by the amount of minimal daily allocation of water (Mini) in each monkey DE and HU.

