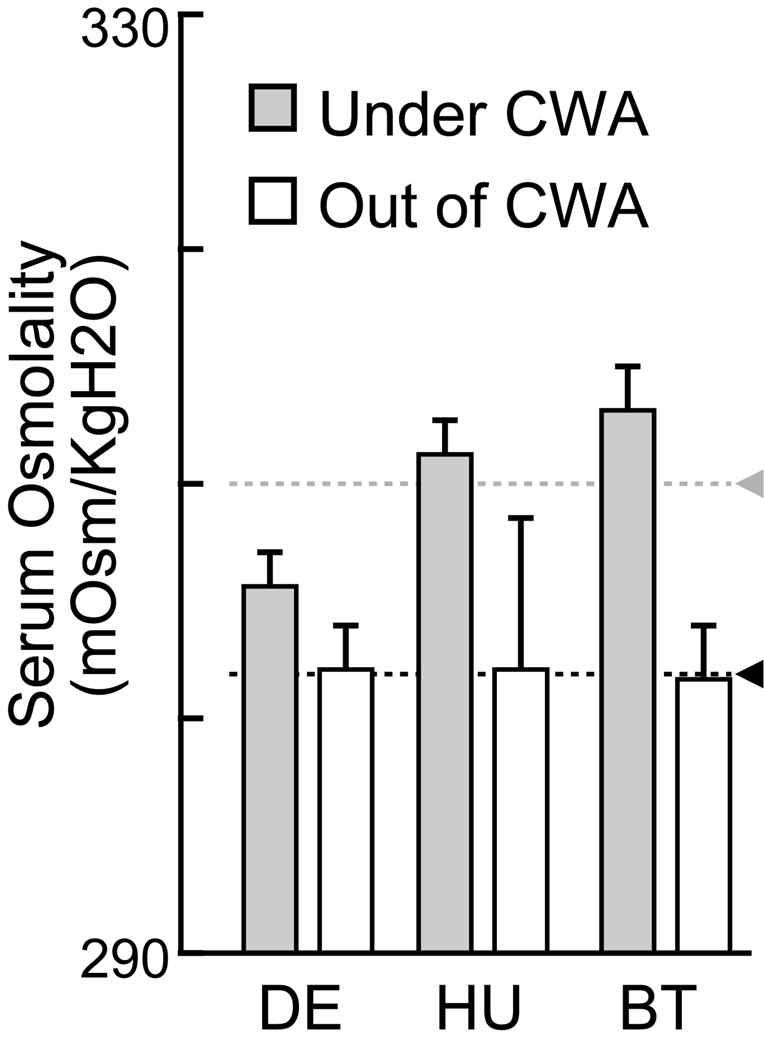
Fig. 3. Serum osmolality measured under and out of controlled water access.
Average plot of serum osmolality in each monkey under and out of controlled water access (CWA). The data under CWA was same as in experiment 1. Error bars indicate standard errors of the mean. Gray and black triangles with dashed lines indicated average across monkeys under and out of controlled water access, respectively.

