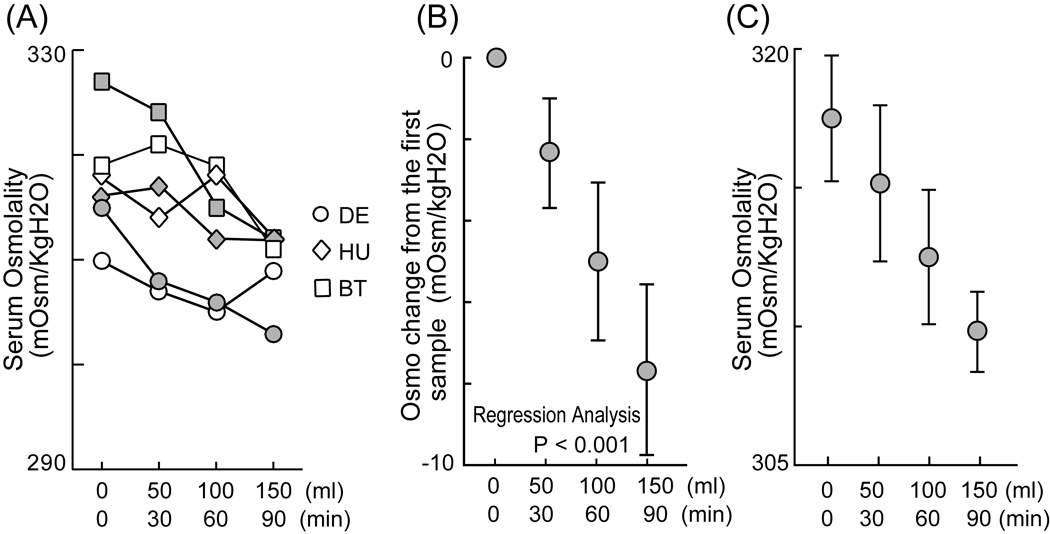
Fig. 4. Decrease of serum osmolality after water intake within a day.
(A) Plot of serum osmolality against water intake every 30min. The two series of samples for each of the three monkeys are represented. (B) Plot of average changes in serum osmolality from the first sample before water intake. (C) Plot of average serum osmolality again water intake every 30min. Error bars indicate standard errors of the mean.

