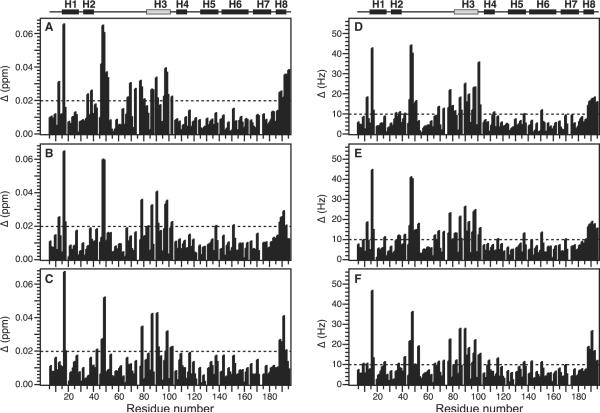
Figure 3.
Total change in chemical shift as a function of Bid residue number, obtained in the presence of 1.2 mM Humanin peptide. Effects are shown for three different Humanin peptides: (A and D) HN(1–12)C8A; (B and E) HN(3–12); and (C and F) HN(3–12)C8A. Total changes are shown in (A–C) p.p.m. (Δ(p.p.m.) = [(ΔH(p.p.m.))2 + (ΔN(p.p.m.) / 5)2]1 / 2), or (D–F) Hz (Δ(Hz) = [(ΔH(Hz))2+(ΔN(Hz))21 / 2). The helical regions in the NMR structure of Bid are mapped above the graph. Helix H3 with the BH3 domain is in gray.

