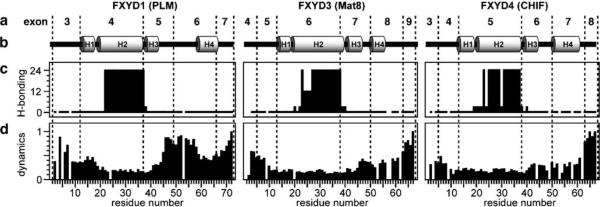
Fig. 2.
Correlation between gene and protein structure for FXYD1, FXYD3, and FXYD4. Residue numbering begins at 1 after the signal sequence. a Exon numbers are shown above the structures, and dashed lines mark the intron–exon junctions. b Secondary helical structures of the proteins. c The amide hydrogen exchange rates (classified as rapid <1 h, short <3 h, medium <12 h, long >24 h), highlight the strong hydrogen bonds in the transmembrane helices. d The profiles of backbone dynamics (classifed from static ~0, to mobile ~1) identify flexible linkers between helices H3 and H4, particularly prominent for FXYD1

