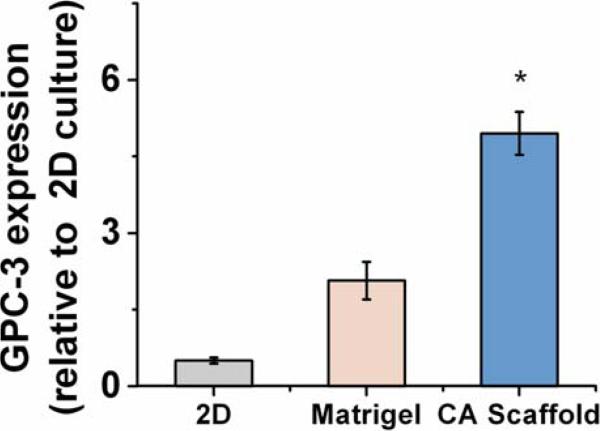
Fig. 4.
Glypican-3 (GPC-3) expression by HepG2 hepatocellular carcinoma cells cultured in vitro for 10 days on 2D tissue culture plates, Matrigel matrices, and CA scaffolds, as determined by dot blot analysis. Results are mean ± s.d., and * indicates at least one of the means is statistically different from the others, p < 0.05, n = 4.

