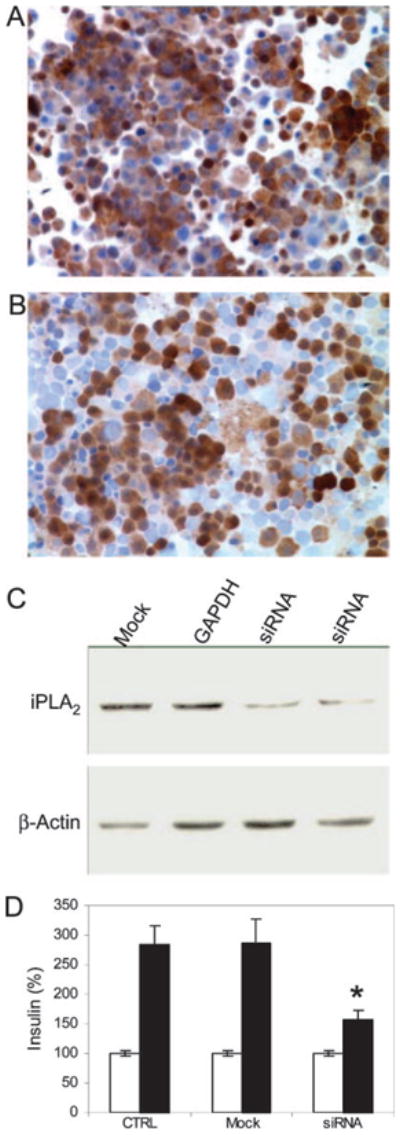
Fig. 1. Specific Inhibition of iPLA2 Expression in INS-1 Cells by siRNA.

INS-1 cells transfected with mock (A) or siRNA (B) were spun on the slides and stained for iPLA2 (brown) and nuclei (light blue) (original magnification, ×100). About 50% of the cells expressed iPLA2, corresponding to the transfection efficiency of this method in INS-1 cells. C, Western blot analysis of siRNA inhibition of iPLA2 expression. INS-1 cells were transfected with either mock, GAPDH-specific siRNA, or iPLA2-specific siRNA (independent duplicates) constructs, respectively. Protein bands corresponding to iPLA2 and β-actin are indicated. D, Comparison of insulin secretion by INS-1 cells that were untransfected (CTRL), mock-transfected (Mock), or transfected with psiRNA-iPLA2 (siRNA). Insulin secretion (ng/ml) in the presence of 3 mM glucose (open bars) and 20 mM glucose (solid bars) is indicated. siRNA silencing of iPLA2 expression in INS-1 cells (n = 12) resulted in decreased levels of glucose-stimulated insulin secretion compared with untransfected (n = 18) or mock-transfected (n = 12) cells. Mean ± SEM is given. Data were compared with a two-tailed unpaired t test. *, P < 0.01.
