
Figure 1.
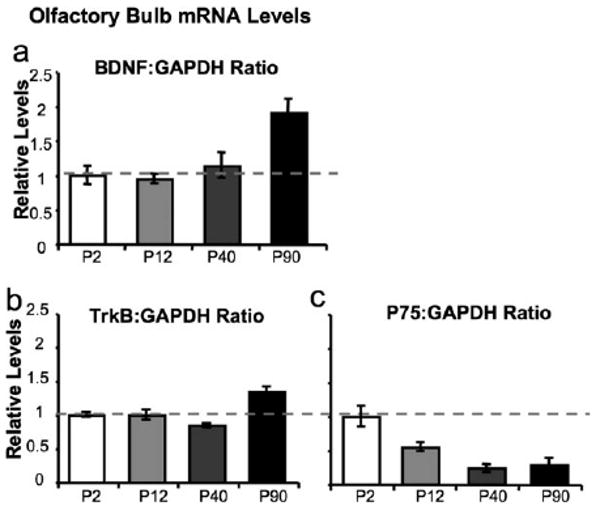
Developmental expression of BDNF, TrkB, and p75NTR in mouse OB. Histograms depict relative levels of (a) BDNF, (b) TrkB, and (c) p75NTR mRNA in the olfactory bulb of mice at different developmental time points (n = 3 per group). All samples were run in triplicate and normalize to GAPDH.