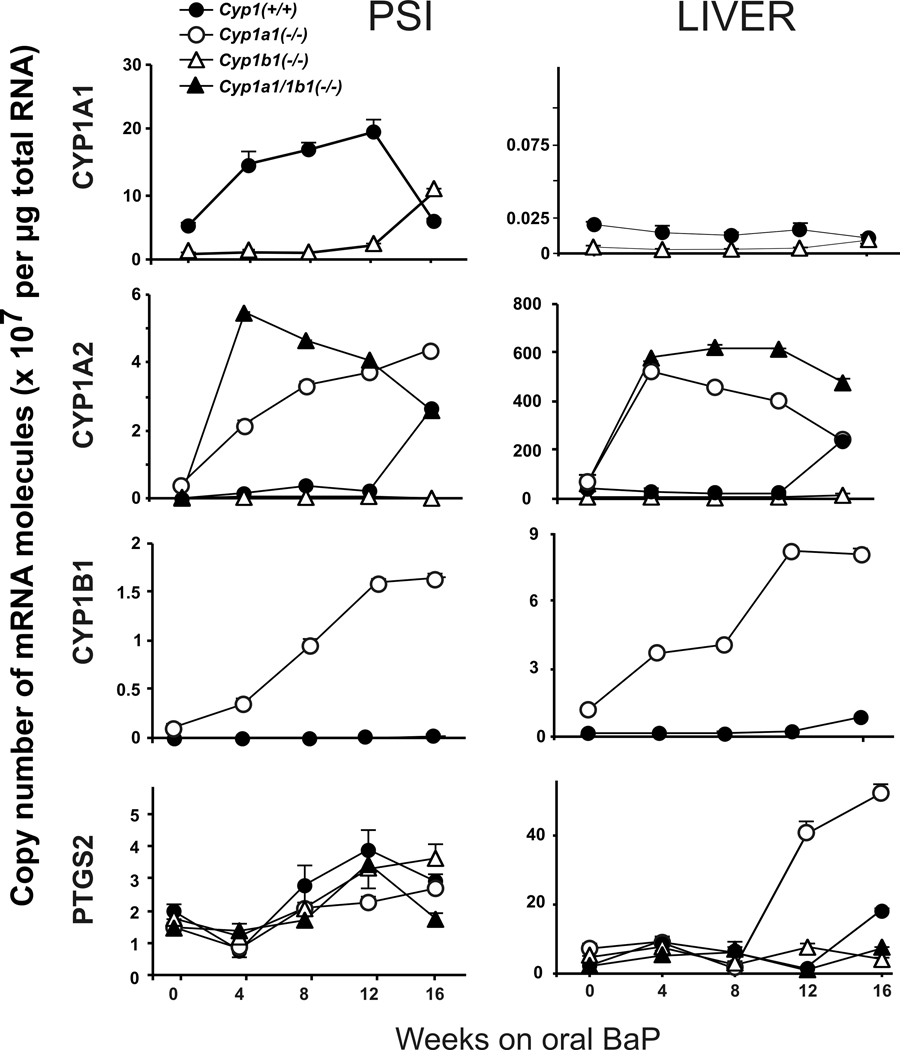
Figure 4.
Time-course of CYP1A1, CYP1A2, CYP1B1, and PTGS2 mRNA levels in the PSI, liver and PGD from Cyp1(+/+), Cyp1a1(−/−) and Cyp1a1/1b1(−/−) mice over the course of 16 weeks of oral BaP at 12.5 mg/kg/day. Brackets denote S.E.M.; when bracket cannot be seen, the S.E.M. is within the size of the symbol.

