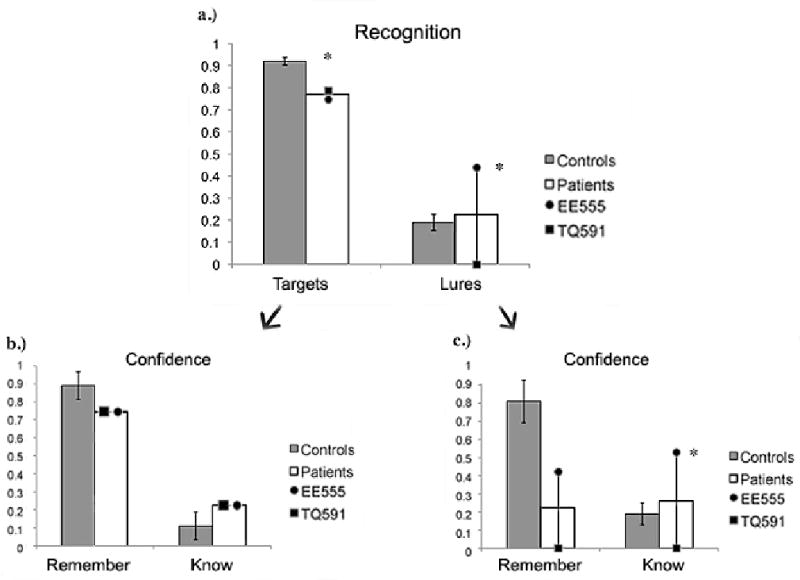
Figure 4.

Results from (a) the recognition portion of the Visual DRM task used in Experiment 2; (b) R/K responses to targets; and (c) R/K responses to lures. Data are raw accuracy for targets and lures. Error bars represent the standard error of the mean.
