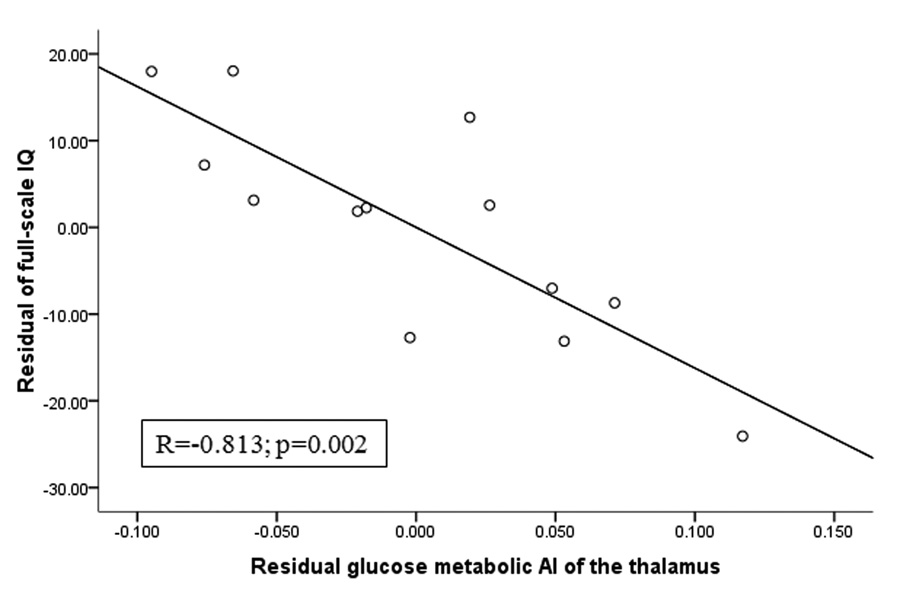
Figure 3.
Partial regression plot of glucose metabolic asymmetry of the thalamus vs. full-scale IQ, after controlling for age and the extent of hypometabolic cortex, in the subgroup of 13 children with left hemispheric involvement. The values represent residuals from regressing asymmetry and full-scale IQ on age and extent of hypometabolic cortex. Full-scale IQ showed a strong negative correlation with glucose metabolic AI of the thalamus even after controlling for other predictors.

