
Figure 2.
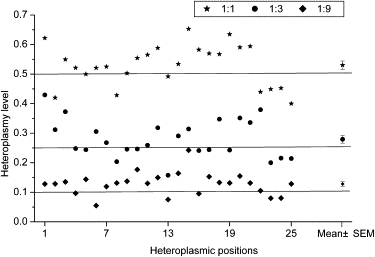
Heteroplasmy Level Estimated from Sequencing Reads for the Expected Heteroplasmic Positions in the Artificially Mixed Samples
Horizontal lines indicate the expected heteroplasmy levels. The rightmost column gives the mean and standard error of the mean value of all heteroplasmic positions under each mixture ratio.